Class 12 Humanities . Economics . Indian Economic Development . Comparative Development Experiences of India and Its Neighbours
Chapter 8: Comparative Development Experiences of India And Its Neighbours
Ch 8
Economics
Class 12 Humanities
Developmental Path -A Snapshot View
Why Compare Neighbouring Economies?
| Country | Political/economic setup noted in the lecture |
|---|---|
| India | The world’s largest democracy, with a secular and liberal Constitution. |
| Pakistan | A militarist political power structure. |
| China | A one-party command economy that later began economic liberalisation. |
Shared Starting Points and Planning
Independence and Five-Year Plans
- 1947India and Pakistan became independent.
- 1949The People’s Republic of China was established.
- 1951–56India’s First Five-Year Plan.
- 1953China announced its First Five-Year Plan.
- 1956Pakistan announced its first five-year plan, later called the Medium Term Development Plan.
- Until March 2017India followed a Five-Year Plan-based development model.
- 2018–23Pakistan’s 12th Five-Year Development Plan.
- 2021–25China’s 14th Five-Year Plan.
China’s Development Path
Major Changes in China
- 1958The Great Leap Forward began; communes covered almost all of China’s farm population.
- 1965Mao introduced the Great Proletarian Cultural Revolution.
- 1966–76The Cultural Revolution sent students and professionals to the countryside.
- 1978Reforms began that later underpinned China’s rapid industrial growth.
China’s Reforms from 1978
- Phased reforms: The first phase focused on agriculture, foreign trade and investment; a later phase introduced industrial reforms.
- Agriculture: Commune land was divided into small plots and allocated to households for use, not ownership. Households could keep income after paying stipulated taxes.
- Industry: Private firms and township and village enterprises (TVEs), owned and operated by local collectives, were allowed to produce goods.
- State enterprises: State-Owned Enterprises (SOEs) were exposed to competition.
- Foreign investment: Special Economic Zones (SEZs) were established to attract foreign investors.
Dual pricing — A system in which some fixed quantities of inputs and outputs are bought or sold at government-set prices, while the remainder is traded at market prices.
Pakistan’s Development Path
- Import substitution
- Promoting domestic production of goods that would otherwise be imported, often using tariffs or import controls.
- Commune
- A rural collective in which people cultivated land together.
- Township and village enterprises (TVEs)
- Enterprises owned and operated by local collectives in China.
- State-Owned Enterprise (SOE)
- An enterprise owned by the government.
- Special Economic Zone (SEZ)
- A designated area established in China to attract foreign investment.
What was dual pricing in China’s reform process?
State two ways Pakistan encouraged economic growth in the late 1970s and 1980s.
Quick recap
- India, Pakistan and China began planning around a similar period; all had similar growth rates and per capita incomes until the 1980s.
- India and Pakistan used public-sector expansion and higher social-development spending; Pakistan also followed a mixed-economy model.
- China’s early development involved central control, communes, the Great Leap Forward and the Cultural Revolution.
- China’s reforms from 1978 moved through agriculture, trade and investment, then industry; they included dual pricing and SEZs.
- Pakistan moved from import substitution and nationalisation towards denationalisation and private-sector incentives.
- Planning milestones include India’s 1951–56 plan, China’s first plan in 1953 and Pakistan’s first plan in 1956.
Demographic Indicators
Population and Demographic Indicators
Sex ratio — The number of females per 1,000 males.
Key demographic patterns
- Population: Roughly one out of every six people worldwide is Indian and another is Chinese; Pakistan’s population is about one-tenth of India’s or China’s.
- Density: China has the largest area of the three countries but the lowest population density.
- Population growth: Pakistan’s rate is highest, followed by India and then China.
- Sex ratio: It is below 1,000 females per 1,000 males in all three countries; son preference is cited as a reason for the imbalance.
- Fertility and urbanisation: China has the lowest fertility rate and highest urbanisation; Pakistan has the highest fertility rate.
| Country | Population (million) | Annual population growth (%) | Density (per sq. km) | Sex ratio | Fertility rate | Urbanisation (%) |
|---|---|---|---|---|---|---|
| India | 1,352 | 1.03 | 455 | 924 | 2.2 | 34 |
| China | 1,393 | 0.46 | 148 | 949 | 1.7 | 59 |
| Pakistan | 212 | 2.05 | 275 | 943 | 3.6 | 37 |
Population policy and its effects
- China introduced the one-child norm in the late 1970s.
- The policy helped keep population growth low and is also linked by scholars to a decline in the sex ratio.
- Over time, a larger elderly population relative to young people became a concern.
- China later allowed couples to have two children; all three countries have also taken steps to improve sex ratios.
GDP and Overall Growth
GDP (PPP) and growth comparison
- GDP (PPP): China’s GDP was 22.5 trillion US dollars, India’s was 9.03 trillion and Pakistan’s was 0.94 trillion.
- Relative size: India’s GDP was about 41% of China’s; Pakistan’s was roughly 11% of India’s.
- Growth pattern: In 1980–90, China achieved near double-digit growth, Pakistan grew faster than India, and India had the lowest rate.
- Later changes: By 2015–17, India’s growth had increased moderately, while China’s and Pakistan’s had declined.
- Pakistan’s slowdown: Scholars cite reform processes and long-term political instability as possible reasons for the decline.
| Country | 1980–90 | 2015–17 |
|---|---|---|
| India | 5.7 | 7.3 |
| China | 10.3 | 6.8 |
| Pakistan | 6.3 | 5.3 |
Sectoral Contribution and Employment
Gross Value Added (GVA) — A measure of the value added by different sectors; the lecture compares each sector’s contribution to GVA with its share of the workforce.
Agriculture and structural change
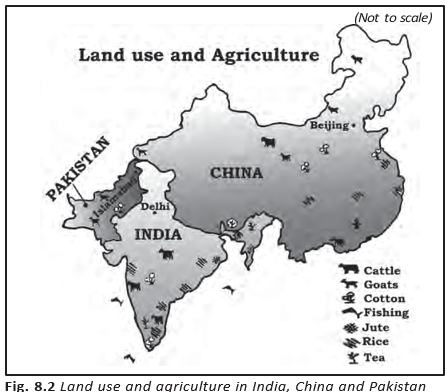
- China’s land: Topography and climate limit cultivation to about 10% of its total land; its cultivable area is about 40% of India’s.
- Employment shift in China: Until the 1980s, over 80% of people depended on farming. The government encouraged movement into handicrafts, commerce and transport.
- China in 2018–19: Agriculture employed 26% of the workforce but contributed only 7% of GVA.
- Agriculture in India and Pakistan: It contributed 16% of India’s GVA and 24% of Pakistan’s, while employing 43% and 41% of their workforces respectively.
| Sector | India GVA | China GVA | Pakistan GVA | India workforce | China workforce | Pakistan workforce |
|---|---|---|---|---|---|---|
| Agriculture | 16 | 7 | 24 | 43 | 26 | 41 |
| Industry | 30 | 41 | 19 | 25 | 28 | 24 |
| Services | 54 | 52 | 57 | 32 | 46 | 35 |
| Total | 100 | 100 | 100 | 100 | 100 | 100 |
| Point | China | India and Pakistan |
|---|---|---|
| Normal development pattern | Employment and output have shifted from agriculture towards industry and then services. | The shift from agriculture is occurring more directly towards services, with a smaller industrial workforce share. |
| Industry | Contributes 41% of GVA and employs 28% of the workforce. | India: 30% of GVA and 25% of workforce; Pakistan: 19% of GVA and 24% of workforce. |
| Services | Largest GVA contributor at 52%; employs 46% of the workforce. | Largest GVA contributor: 54% in India and 57% in Pakistan. |
Services and sectoral growth
- Services: This sector contributes the largest share of GVA in all three countries and is an increasingly important potential employer.
- Service employment: In the 1980s, services employed 17% of India’s, 12% of China’s and 27% of Pakistan’s workforce; by 2019, the shares were 32%, 46% and 35%.
- Agriculture: Its output growth declined over the period, although it continued to employ the largest workforce share in each country.
- China: Growth has been strongly supported by manufacturing and services; industrial growth was near double-digit in the 1980s but slowed later.
- India: Service-sector output growth increased, making services a major contributor to growth.
- Pakistan: Growth decelerated in agriculture, industry and services.
| Country | 1980–90 Agriculture | 1980–90 Industry | 1980–90 Services | 2014–18 Agriculture | 2014–18 Industry | 2014–18 Services |
|---|---|---|---|---|---|---|
| India | 3.1 | 7.4 | 6.9 | 3.1 | 6.9 | 7.6 |
| China | 5.9 | 10.8 | 13.5 | 3.1 | 5.3 | 7.1 |
| Pakistan | 4.0 | 7.7 | 6.8 | 1.7 | 4.8 | 5.0 |
Key Demographic and Sectoral Shifts
- Late 1970sChina introduced the one-child norm to restrain population growth.
- Until the 1980sMore than 80% of China’s population depended on farming for a livelihood.
- 1980sChina’s industrial growth was near double-digit; Pakistan had a larger service-workforce share than India or China.
- 2015–17GDP growth was 7.3% in India, 6.8% in China and 5.3% in Pakistan.
- 2018–19Sectoral GVA and workforce shares showed services as the largest GVA contributor in all three countries.
Compare the demographic indicators of India, China and Pakistan.
Describe the broad sectoral shift in India, China and Pakistan.
Quick recap
- Pakistan has the fastest population growth; China has the lowest density and fertility rate.
- China’s one-child norm slowed population growth but contributed to concerns about sex ratio and population ageing.
- China had the highest GDP (PPP), while India’s GDP was about 41% of China’s.
- Agriculture employs a large share of the workforce but contributes a smaller share of GVA, especially in China.
- Services are the largest GVA contributor in India, China and Pakistan.
- China’s growth is supported by manufacturing and services; India’s by services, while Pakistan’s growth slowed across sectors.
Indicators of Human Development
Selected Human Development Indicators (2017–2019)
| Indicator | India | China | Pakistan |
|---|---|---|---|
| Human Development Index (HDI) value | 0.645 | 0.761 | 0.557 |
| HDI rank | 130 | 87 | 154 |
| Life expectancy at birth (years) | 69.7 | 76.9 | 67.3 |
| Mean years of schooling (aged 15 and above) | 6.5 | 8.1 | 5.2 |
| Gross National Income per capita (PPP, US dollars) | 6,681 | 16,057 | 5,005 |
| People below national poverty line (%) | 21.9* | 1.7** | 24.3* |
| Infant mortality rate (per 1,000 live births) | 29.9 | 7.4 | 57.2 |
| Maternal mortality rate (per 1 lakh births) | 133 | 29 | 140 |
| Population with at least basic sanitation (%) | 60 | 75 | 60 |
| Population using at least basic drinking-water source (%) | 93 | 96 | 91 |
| Undernourished children (%) | 37.9 | 8.1 | 37.6 |
Reading the Data
- Overall comparison: China has the highest HDI value and best rank among the three; a lower rank number indicates a higher position.
- Income and poverty: China has the highest GNI per capita and the smallest reported share of people below the national poverty line.
- Health and education: China has the highest life expectancy and mean years of schooling, and the lowest infant and maternal mortality rates.
- Literacy: The comparison also identifies China as ahead of India and Pakistan in literacy.
- Basic services: China has the highest sanitation and drinking-water access figures; India and Pakistan both report 60% access to basic sanitation.
- Poverty and sanitation: China and Pakistan perform better than India in reducing poverty; Pakistan’s sanitation figure equals India’s, while China’s is higher.
- Nutrition: China has a much smaller share of undernourished children than India and Pakistan.
- Poverty data years: India and Pakistan figures are for 2011; China’s figure is for 2015.
- Maternal deaths per 1 lakh births: China 29; India 133; Pakistan 140.
Limits of Human Development Indicators
Liberty indicators — Measures of people’s freedoms and protections in social and political life that complement standard human development indicators.
Why Standard Indicators Are Incomplete
- Useful but insufficient: Income, health and education indicators measure important aspects of development but do not capture every dimension.
- Democratic participation: An indicator of participation in social and political decision-making is included, but is not given extra weight.
- Rights and institutions: Measures of constitutional protection of citizens’ rights, judicial independence and the rule of law have not been introduced.
- Implication: Without these and other liberty indicators—and without giving them overriding importance—the HDI remains incomplete and its usefulness limited.
- HDI
- Human Development Index; a composite measure used to compare countries’ human development.
- Infant mortality rate
- Infant deaths per 1,000 live births.
- Maternal mortality rate
- Maternal deaths per 1 lakh births.
- Liberty indicators
- Measures relating to democratic participation, citizens’ rights, judicial independence and the rule of law.
Why are conventional human development indicators considered incomplete?
Quick recap
- China leads India and Pakistan on HDI value, income per capita, life expectancy, literacy and the reported mortality indicators.
- China has the lowest reported poverty share; the poverty figures refer to different years across the countries.
- China has the highest reported sanitation and drinking-water access; India and Pakistan have equal sanitation access in the table.
- Human development indicators are important but do not cover every dimension of people’s lives.
- Liberty indicators include democratic participation, constitutional rights, judicial independence and the rule of law.
- Without adequate liberty measures and importance given to them, the HDI remains incomplete and limited.
Development Strategies - An Appraisal
Reform Timelines
Beginning of Reforms
- 1978China initiated reforms.
- 1988Pakistan initiated reforms.
- 1991India initiated reforms.
China: Reasons for Reform and Earlier Foundations
Why China Reformed in 1978
- Not externally compelled: China did not face the reform conditions imposed by the World Bank and IMF on India and Pakistan.
- Slow growth: New leaders were dissatisfied with weak growth and limited modernisation under Maoist rule.
- Maoist approach questioned: Decentralisation, self-sufficiency and rejection of foreign technology, goods and capital were seen as unsuccessful.
- Limited grain gains: Despite land reforms, collectivisation and the Great Leap Forward, per-capita grain output in 1978 was at its mid-1950s level.
Foundations Supporting Post-Reform Growth
- Social infrastructure: Earlier investment in education and health, including wide rural basic-health services, improved social and income indicators.
- Land and planning: Land reforms and a long history of decentralised planning created a base for later reforms.
- Small enterprises: Their pre-reform presence helped support economic development.
- Food distribution: The commune system enabled more equitable distribution of food grains.
China’s Gradual Reform Approach
- Test each reform on a small scale
- Assess its economic, social and political costs and outcomes
- Expand successful measures on a large scale
Effects of China’s Agricultural Reform
- Plots of land were handed to individuals for cultivation
- Poor households gained greater prosperity
- Conditions developed for rapid growth of rural industries
- A stronger support base formed for further reforms
Pakistan: Reform Outcomes and Challenges
Economic and Poverty Trends
- Growth: Scholars argue that reforms were followed by worsening economic indicators; GDP growth and sectoral growth had not improved compared with the 1980s.
- Poverty: International-poverty-line data appears relatively favourable, but official Pakistani data cited by scholars indicates poverty has risen in recent decades.
- Poverty trend: The poor were over 40% of the population in the 1960s; the share fell to 25% in the 1980s, then began rising again.
Factors Behind Pakistan’s Slowdown and Renewed Poverty
- Agricultural growth and food supply relied heavily on good harvests
- Technical change was not institutionalised or sustained
- Poor harvests led to stagnation or negative economic trends
- Growth and poverty outcomes became vulnerable to changes in harvests
| Point | Sustainable source | Pakistan’s reported sources |
|---|---|---|
| Foreign exchange | Steady exports of manufactured goods can reduce reliance on borrowing. | Mainly remittances from workers in the Middle East and exports of highly volatile agricultural products. |
| Long-term effect | A reliable export base helps meet foreign-exchange needs. | Dependence on foreign loans increased, while repayment became more difficult. |
Recent Recovery
- GDP: Pakistan’s economic recovery had been sustained in recent years; it recorded 5.5% growth in 2017–18, its highest rate compared with the previous decade, according to the Annual Plan 2019–20.
- Sector growth: Agriculture remained unsatisfactory; industry grew by 4.9% and services by 6.2%.
- Indicators: Several macroeconomic indicators began showing stable and positive trends.
Why did China’s pre-reform foundations matter after 1978?
What made Pakistan’s agricultural growth and food supply vulnerable?
Quick recap
- China, Pakistan and India initiated reforms in 1978, 1988 and 1991, respectively.
- China’s reform drive responded to slow growth and limited modernisation under Maoist policies.
- China’s pre-reform social services, land reforms and decentralised planning helped support later progress.
- China tested reforms locally before scaling successful measures; agricultural reform benefited poor households and rural industries.
- Pakistan’s growth and poverty outcomes were linked to harvest-dependent agriculture and food supply.
- Pakistan relied on remittances, volatile agricultural exports and foreign loans, but reported sustained recovery and 5.5% growth in 2017–18.
Conclusion
Different Outcomes After a Similar Start
Shared context
- Starting point: India, China and Pakistan had similarly low development until the late 1970s; growth rates and sectoral contributions remained similar until the early 1980s.
- Common features: They have similar physical endowments and follow planned development, but have different political systems and policy-implementation structures.
- Globalisation: Developing countries study neighbours’ development paths as they compete with developed countries and with one another.
Reforms
- 1978China introduced reforms on its own initiative.
- 1988Pakistan introduced reforms under pressure from international agencies.
- 1991India introduced reforms under pressure from international agencies.
Country-Specific Experiences
| Point | India | China | Pakistan |
|---|---|---|---|
| Political setting and performance | Democratic institutions; moderate performance. | Political freedom and its implications for human rights remain major concerns; strong growth and poverty alleviation. | Political instability is one factor linked by scholars to economic slowdown. |
| Recent economic picture | Initiatives to develop infrastructure and improve living standards. | Used market mechanisms while retaining political commitment. | In the last five years, macroeconomic indicators began showing positive, moderate growth, reflecting economic recovery. |
| Public sector and markets | Attempting to privatise public-sector enterprises. | Used the market mechanism to create additional social and economic opportunities. | Attempting to privatise public-sector enterprises. |
| Agricultural dependence | The majority still depends on agriculture; dependence is greatest among the three. | The majority of the workforce still depends on agriculture. | The majority of the workforce still depends on agriculture. |
Distinctive policy factors
- Pakistan’s slowdown: Scholars point to political instability, over-dependence on remittances and foreign aid, and volatile agricultural performance.
- China’s land policy: Collective ownership of land was retained while individuals were allowed to cultivate it, supporting rural social security.
- China’s social infrastructure: Public intervention in social infrastructure before reforms contributed to positive human-development indicators.
Structural Change and Human Development
| Point | China | India and Pakistan |
|---|---|---|
| Development path | Gradual shift from agriculture to manufacturing, then services. | Shift directly from agriculture towards services. |
| Industrial growth | Maintained a high industrial growth rate. | Industrial growth was lower than China’s. |
| GDP per capita | Rose more rapidly than in India and Pakistan. | Rose less rapidly than in China. |
| Human-development indicators | Ahead of India and Pakistan on many indicators; improvements were attributed to pre-reform strategies, not to the reform process. | Behind China on many indicators. |
Population and assessment
- Workforce: Even after about seventy years of planned development, most workers in all three countries still depend on agriculture; this dependence is greatest in India.
- Population growth: China’s one-child norm arrested population growth; India and Pakistan have yet to experience a comparable major change.
- Assessment: Compare development indicators alongside liberty indicators.
- Market mechanism
- Use of market processes to create economic and social opportunities.
- Collective ownership
- Land remains collectively owned while individuals are permitted to cultivate it.
- Liberty indicators
- Measures of freedom considered alongside development indicators.
Why did China’s GDP per capita rise more rapidly than that of India and Pakistan?
Quick recap
- India, China and Pakistan began with similar low development but later achieved different outcomes.
- All three followed planned development, with different political systems and implementation structures.
- Reforms began in China in 1978, Pakistan in 1988 and India in 1991; China acted on its own initiative.
- China followed the agriculture-to-manufacturing-to-services path; India and Pakistan shifted more directly towards services.
- China’s stronger industrial growth drove a faster rise in GDP per capita; pre-reform strategies explain its human-development gains.
- Agriculture still employs most workers in all three countries, especially in India; compare liberty indicators as well as development indicators.
Economics — ALL CHAPTERS
1
Indian Economy On The Eve Of Independence
2
Indian Economy 1950–1990
3
Liberalisation, Privatisation And Globalisation: An Appraisal
4
Human Capital Formation In India
5
Rural Development
6
Employment : Growth, Informalisation And Other Issues
7
Environment and Sustainable Development
8
Comparative Development Experiences of India And Its Neighbours
1
Introduction
2
National Income Accounting
3
Money and Banking
4
Determination of Income and Employment
5
Government Budget and the Economy
6
Open Economy Macroeconomics