Class 9 . Mathematics . Ganita Manjari . The Mathematics of Maybe Introduction to Probability
Chapter 7: The Mathematics of Maybe: Introduction to Probability
Ch 7
Mathematics
Class 9
What is Probability?
Randomness and Random Experiments
Key ideas
- Random experiment: A repeatable trial whose result may vary each time and cannot be known beforehand.
- Examples: Tossing a coin has outcomes heads or tails; rolling a die has outcomes from to .
- Lucky draw: The selected student is unpredictable; if each slip is equally likely to be drawn, every student has an equal chance.
- Fair decision: A coin toss can fairly choose which cricket team bats first because either team has an equal chance of winning the toss.
Knowing the possible outcomes does not reveal which one will occur on a particular roll.
Identify randomness
- List the outcomes that could happen.
- Check whether the exact outcome is known before the trial.
- If the outcome is uncertain, the trial is random.
Why is rolling a die a random experiment?
- For a die roll, the possible results are the six face values.
- Before rolling, no particular face is certain to appear.
Probability and the Probability Scale
Estimating likelihood
- Uncertainty: Probability studies chance; it describes likelihood rather than guaranteeing the exact result of a random trial.
- Subjective probability: A personal estimate based on how someone interprets evidence, such as using current weather to judge whether it may rain.
- Objective estimates: These use evidence and data to estimate likelihood more systematically.
- Rainfall: Rain depends on complex, sensitive factors including temperature, humidity, wind patterns and air pressure, so its exact time and place cannot be predicted with total certainty.
An event's probability lies from to : means impossible, means certain, and values between them express degrees of likelihood.
| Probability | Interpretation |
|---|---|
| Impossible | |
| Between and | Less likely than not |
| Even chance; two outcomes are equally likely | |
| Between and | More likely than not |
| Certain |
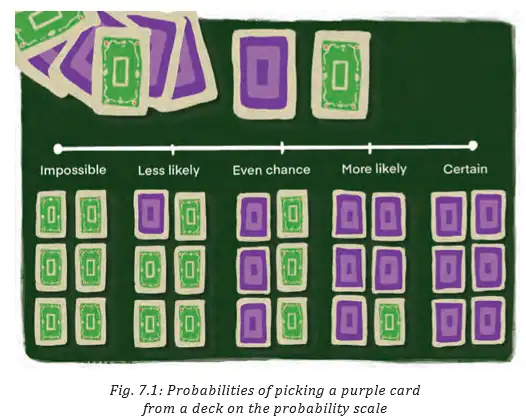
| Event | Scale description | Reason |
|---|---|---|
| Getting a number greater than on a standard die | Impossible | A die has faces numbered to . |
| Rolling a on a standard die | Less likely | Only one face shows . |
| Getting heads on a coin toss | Even chance | Heads and tails are equally likely. |
| Drawing a card numbered to from a -card deck | More likely | There are such cards. |
| Choosing a red sweet from a bag containing only red sweets | Certain | Every sweet is red. |
A fair coin gives heads and tails equal probability.
Read a probability value
- Locate the probability between and .
- Compare it with to describe whether the event is less likely, equally likely or more likely than not.
- Use the endpoints for impossible and certain events.
What is the probability of getting heads when a fair coin is tossed, and how should it be described?
- A fair coin has two equally likely outcomes.
- One of the two outcomes is heads, so heads has probability one-half.
- A probability of is an even chance.
- A random trial has known possible outcomes but an uncertain result.
- Probability measures likelihood on a scale from (impossible) to (certain).
- A probability of represents an even chance.
Quick recap
- Randomness means the possible outcomes are known, but the exact result cannot be predicted in advance.
- A repeatable uncertain trial, such as tossing a coin or rolling a die, is a random experiment.
- Probability measures how likely an event is and can be estimated subjectively or objectively.
- Probability ranges from (impossible) to (certain).
- A probability of means an even chance; values below or above it mean less or more likely than not.
Measuring Probability Objectively Part-1
Two Objective Ways to Estimate Probability
| Point | Experimental probability | Theoretical probability |
|---|---|---|
| Basis | Observed data from repeated trials or past observations | Reasoning about outcomes assumed equally likely |
| Estimate | Relative frequency of the event | Favourable outcomes divided by total possible outcomes |
Theoretical Probability
Theoretical probability — A probability found by reasoning about equally likely outcomes rather than using observed data.
Use this method only when there is no reason to expect one possible outcome to be more likely than another.
Use when all outcomes in the sample space are equally likely; is the number of favourable outcomes and is the total number of outcomes.
Finding theoretical probability
- List the possible outcomes in the sample space.
- Count all possible outcomes and the outcomes that make the event happen.
- Divide the favourable count by the total count.
A fair die is rolled. Find the theoretical probability of getting a number greater than 4.
- A fair die is rolled. Find the probability of getting a number greater than 4.
- The favourable outcomes are 5 and 6, so there are two favourable outcomes out of six.
- Simplify the fraction.
Experimental Probability
Experimental probability — The relative frequency of an event, calculated from results observed over repeated trials or recorded data.
Experiments and sample spaces
- Experiment: A process that produces a result.
- Outcome: One possible result of an experiment.
- Sample space: The set of all possible outcomes; list its outcomes inside braces, separated by commas.
- Coin toss: Sample space is , where means heads and means tails.
- Die roll: Sample space is .
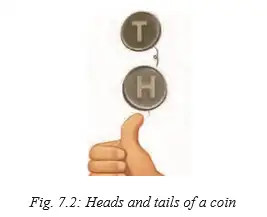
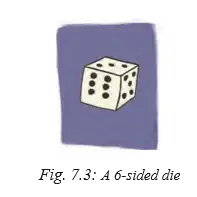
Experimental probability is based on how often the event occurred in the observed trials; it can differ from a theoretical prediction.
The relative frequency of event from a set of trials; is the number of times occurred and is the total number of trials.
Finding experimental probability
- Count how many times the event occurred.
- Count the total number of trials.
- Divide the event count by the trial count; simplify or convert to a decimal or percentage if needed.
A die is rolled 50 times and lands on 4 exactly 8 times. Find the experimental probability of rolling a 4.
- A die is rolled 50 times, and a 4 appears 8 times.
- Simplify the fraction, then express it as a decimal and percentage.
Do not use the number of favourable outcomes divided by total outcomes for experimental probability; use the actual observed counts from the trials.
Practice
A fair coin is tossed once. Find the theoretical probability of getting tails.
In 40 die rolls, a 2 appears 6 times. Find its experimental probability.
A fair die is rolled. Find the theoretical probability of getting an even number.
Quick recap
- Objective probability can be estimated from observed data or by reasoning about equally likely outcomes.
- An outcome is one result; a sample space is the set of all possible results.
- Theoretical probability equals favourable outcomes divided by total possible outcomes when outcomes are equally likely.
- Experimental probability equals the number of observed occurrences divided by the total number of trials.
- Experimental probability is also called relative frequency and may differ from theoretical probability.
Measuring Probability Objectively Part-3
Theoretical Probability
- Meaning: Theoretical probability estimates an event’s likelihood when all possible outcomes are equally likely.
- Formula: P(E) = (number of favourable outcomes) / (number of possible outcomes).
- Example: For a fair six-sided die, the probability of rolling a 4 is 1/6, since one of the six outcomes is favourable.
- Key condition: It is based on reasoning about a fair situation and does not require experimental data.
Quick recap
- Theoretical probability assumes equally likely outcomes and uses no trial data.
- Calculate probability as favourable outcomes divided by all possible outcomes.
- Experimental probability estimates likelihood using collected observations.
- Sampling uses a representative part of a population to estimate its characteristics.
- With more trials, experimental probability tends to approach theoretical probability.
- Independent fair tosses and rolls are not affected by previous results.
Elements of Probability: Sample Spaces and Events
Sample Space
For a finite sample space, equals the number of distinct outcomes listed in .
Use this to state how many distinct outcomes are in the sample space.
Writing a sample space
- Identify the random experiment and what the question asks you to record.
- List every distinct outcome that can occur at the chosen level of detail.
- Check that no outcome is missing or repeated, then count the outcomes.
Write the sample space and sample size for tossing two coins.
- For two coins, record the result of the first coin and then the second coin.
- Write each ordered result once as an outcome in the sample space.
- Count the distinct outcomes to find the sample size.
Do not merge outcomes that the question distinguishes: for two coins, and are different outcomes.
Events
An event can contain only outcomes that belong to the sample space.
Use subset notation to show that an event is drawn from the sample space.
Identifying an event
- Write the sample space for the experiment.
- Select the outcomes that satisfy the event description.
- Check that each selected outcome belongs to the sample space.
For one roll of a standard die, find the event that the number is greater than four.
- Write all possible die-roll outcomes.
- Select the outcomes greater than four.
- Confirm that the event outcomes are contained in the sample space.
A match can end in a win, loss, or draw. Write its sample space and sample size.
For two coin tosses, write the event that exactly one coin shows heads.
Quick recap
- A sample space lists every distinct possible outcome of an experiment.
- The sample size is the number of outcomes in .
- For one coin toss, ; for a die roll, .
- For two coin tosses, , with and distinct.
- An event is a subset of the sample space: .
- Choose a sample space detailed enough for the question being studied.
Tree diagrams
Building and Reading a Tree Diagram
- Branches: Start at one point; draw a branch for each possible outcome at every step of the experiment.
- Paths: Follow each route from start to finish to identify one complete outcome; the full set of paths gives the sample space.
- Example: For two coin tosses, the paths are HH, HT, TH and TT.
Summary
Probability and Its Scale
Probability — Probability measures how likely an event is to occur.
An impossible event has probability , a certain event has probability , and every event has a probability between them.
denotes the probability of event .
Interpreting a probability
- Check that the probability lies between impossibility and certainty.
- Interpret values near as unlikely and values near as likely.
What is the probability of rolling an even number on a fair six-sided die?
- A standard die has six equally likely faces. Three show an even number.
- Reduce the fraction and confirm it lies between and .
Sample Spaces and Events
Sample space — The sample space is the set of all possible outcomes of a random experiment, usually denoted by .
Event — An event is one outcome, or a group of outcomes, chosen from the sample space.
Key points
- Sample space: List every possible outcome of the experiment.
- Event: Select the outcome or outcomes that satisfy a stated condition.
- Relationship: Every event is a subset of the sample space.
An event consists of outcomes from the sample space .
Listing outcomes and identifying an event
- Write all possible outcomes as the sample space.
- Choose the outcomes that match the event condition.
Write the sample space and the event of getting tails when one coin is tossed.
- For one coin toss, list both possible outcomes.
- The event of getting tails contains just the tails outcome.
Experimental Probability
Experimental probability — Experimental probability is calculated from the results observed across repeated trials of an experiment.
Divide the number of times the event occurred by the total number of trials.
Use observed results from the experiment. Let be the number of times the event occurred and the total number of trials.
Finding experimental probability
- Count how many trials produced the event.
- Divide that count by the total number of trials.
Find the experimental probability of heads if a coin lands heads 14 times in 25 tosses.
- A coin landed heads times in tosses.
- The fraction is already in simplest form.
Do not divide by the number of times the event did not occur; the denominator is the total number of trials.
Theoretical Probability
Theoretical probability — Theoretical probability uses all possible outcomes, assuming the outcomes are equally likely.
For equally likely outcomes, compare the number of favourable outcomes with the total number of possible outcomes.
Use this formula only when all possible outcomes are equally likely. Here, is the number of favourable outcomes and is the total number of possible outcomes.
Finding theoretical probability
- List the possible outcomes and count them.
- Count the outcomes that satisfy the event.
- Divide the favourable count by the possible-outcome count.
Find the theoretical probability of rolling a number greater than 4 on a fair die.
- A fair die has six outcomes, and the outcomes greater than are and .
- There are two favourable outcomes out of six possible outcomes.
Do not use the theoretical formula unless the possible outcomes are equally likely.
Tree Diagrams
Tree diagram — A tree diagram is a branching display used to list and visualise the outcomes of a random experiment.
How tree diagrams help
- Branches: Show the possible outcomes at each stage of an experiment.
- Endpoints: Each complete path gives one possible outcome of the full experiment.
- Use: Tree diagrams help list outcomes and work out probabilities of events.
Using a tree diagram
- Draw a branch for each possible outcome at the first stage.
- From each branch, add the possible outcomes of the next stage.
- List the complete paths and select those matching the event.
Using the outcomes represented by a tree diagram, find the probability of getting exactly one head in two coin tosses.
- Two coin tosses have four equally likely complete paths.
- Exactly one head occurs on paths and .
- Compare the favourable paths with all paths.
A fair spinner has four equally likely outcomes: red, blue, green and yellow. What is the probability of landing on blue or green?
A coin lands tails 18 times in 30 tosses. Find the experimental probability of tails.
Two coins are tossed. Find the probability of getting no heads.
Quick recap
- Probability measures an event's likelihood and satisfies .
- A sample space lists all possible outcomes; an event is a selected outcome or group of outcomes.
- Experimental probability uses observed results: event occurrences divided by total trials.
- Theoretical probability uses favourable outcomes divided by possible outcomes when outcomes are equally likely.
- Tree diagrams show the branches and complete outcomes of a multi-stage random experiment.
Formula sheet
Mathematics — ALL CHAPTERS
1
Orienting Yourself: The Use of Coordinates
2
Introduction to Linear Polynomials
3
The World of Numbers
4
Exploring Algebraic Identities
5
I’m Up and Down, and Round and Round
6
Measuring Space: Perimeter and Area
7
The Mathematics of Maybe: Introduction to Probability
8
Predicting What Comes Next: Exploring Sequences and Progression