Class 12 Commerce . Economics . Introductory Macro Economics . National Income Accounting
Chapter 2: National Income Accounting
Ch 2
Economics
Class 12 Commerce
Some Basic Concepts Of Macroeconomics
Production and Economic Wealth
- Economic wealth: A country’s well-being depends not merely on its natural resources, but on how effectively they are used to generate production, income and wealth.
- Production: People combine their efforts with natural and man-made resources within a social and technological structure to produce goods and services.
Final, Intermediate and Capital Goods
Final good — A good or service meant for final use that will not undergo further transformation in the production process.
How use determines whether a good is final
- Use matters: A good is final or intermediate according to how it is used, not according to its physical nature.
- Cotton chain: Cotton → yarn → cloth → clothing; cotton, yarn and cloth are inputs, while clothing sold to consumers is final.
- Household use: Tea leaves bought for home use are final, even though the consumer transforms them into tea.
- Market production: Tea leaves used by a restaurant are inputs because the restaurant transforms them into a product for sale.
- Home cooking: Cooking for one’s own household is not market production; similar cooking in a restaurant is part of market production.
| Type | Meaning and use | Examples |
|---|---|---|
| Consumption goods | Final goods or services consumed by their ultimate users. | Food, clothing, recreation services |
| Consumer durables | Durable consumption goods with a relatively long life; they wear out and may need repairs. | Televisions, cars, home computers |
| Capital goods | Durable final goods used repeatedly to produce other goods and services; they are not transformed in production. | Tools, machines, buildings, roads |
| Intermediate goods | Goods used as material inputs or raw materials to produce other goods; they are not final goods. | Steel sheets for cars, copper for utensils |
Do not classify a good by its name alone: a machine is usually a capital good, while a car bought by a household is a consumer durable; the good’s economic use determines its category.
Measuring Final Output
- Common measuring rod: Money allows unlike goods and services to be combined into one measure of output.
- Aggregate final output: Add the monetary values of final goods and services produced in the economy during a specified period.
- Why exclude intermediate goods? Their value is already included in the value of final goods.
- Double counting: Adding intermediate goods separately counts the same value more than once and exaggerates total output.
Stocks and Flows
| Point | Stock | Flow |
|---|---|---|
| Meaning | A quantity measured at a particular point in time. | A quantity measured over a period of time. |
| Examples | Capital goods, consumer durables, water in a tank. | Income, output, profits, water flowing into a tank per minute. |
| Time reference | A specific moment or date. | A defined period, often a year. |
- Specify the period: Statements about income or output are incomplete unless their time period is clear.
- Stock changes: Adding a machine to the capital stock is a flow during the period when it is added; the machine itself can remain part of the stock for many years.
Investment and Depreciation
Gross investment — The value of capital goods produced in a period, including goods used to replace worn-out capital.
Depreciation — The annual allowance for the wear and tear of a capital good over its useful life.
- Replacement: Part of gross investment replaces capital that has worn out; it does not add to the existing capital stock.
- Net addition: Net investment measures the new addition to capital stock, also called new capital formation.
- Accounting concept: Depreciation is recorded each year even if no actual replacement spending occurs in that particular year.
- Useful-life estimate: A capital good’s cost is spread across its expected useful life; for a machine lasting 20 years, the annual allowance is one-twentieth of its original value.
Subtract depreciation from gross investment to find the addition to capital stock.
For a capital good with a known useful life, divide its cost by the number of years of useful life.
Consumption, Investment and Growth
- Final output: In a given period, final goods and services take the form of consumption goods or investment goods.
- Short-run trade-off: With total output fixed, producing more capital goods leaves fewer resources for consumption goods, and vice versa.
- Future productivity: More or better capital equipment can raise workers’ productive capacity and increase future output.
- Time matters: Capital-goods production may reduce current consumption while enabling greater production—and potentially more consumption—in the future.
How Investment Can Expand Future Production
- More capital goods are produced
- The economy’s capital stock is added to or maintained
- Workers have more productive equipment
- Productive capacity and possible future output increase
Income, Demand and the Circular Flow
| Factor owner | Income earned |
|---|---|
| Labourer | Wages |
| Entrepreneur | Profits |
| Landlord | Rents |
| Owner of capital | Interest |
Circular Flow Between Firms and the Public
- Firms demand factors of production
- Factor owners receive income from firms
- The public uses income to demand goods and services
- Firms receive payments through sales
- Sales enable production to continue, generating goods and factor incomes again
- Purchasing power: A need becomes effective market demand only when it is backed by the ability to pay.
- Linked activities: Production generates goods and services as well as factor incomes; those incomes help households buy the goods produced.
- Capital goods: Their production also generates income and maintains or expands the capital stock needed for further production.
- Final good
- A good or service for final use that does not undergo further production transformation.
- Intermediate good
- A good used as an input to produce another good or service.
- Stock
- A quantity measured at a particular point in time.
- Flow
- A quantity measured over a period of time.
- Depreciation
- The annual allowance for wear and tear of capital goods.
- Net investment
- Gross investment minus depreciation; the net addition to capital stock.
Why are intermediate goods excluded when measuring the value of final output?
Differentiate between a stock and a flow, with one example of each.
Define depreciation and write the relation between gross and net investment.
Quick recap
- A good’s economic use determines whether it is final or intermediate; final output is measured without double counting.
- Consumption goods meet current consumption needs; capital goods support production, and consumer durables are durable goods for household use.
- Stocks are measured at a point in time; flows are measured over a period.
- Net investment equals gross investment minus depreciation and measures the net addition to capital stock.
- With current total output fixed, more investment can mean less current consumption but greater future productive capacity.
- Factor incomes finance demand, while household demand generates sales for firms, creating a circular flow.
Circular Flow Of Income And Methods Of Calculating National Income
Factor Services and Their Remuneration
Factors of production
- Labour contributes human effort and earns wages.
- Capital contributes capital services and earns interest.
- Entrepreneurship organises production and earns profit.
- Land contributes fixed natural resources and earns rent.
Circular Flow in a Two-Sector Economy
Circular flow of income — The continuous movement of income, spending, output and factor payments between households and firms.
Assumptions of the simplified model
- Sectors: Only households and domestic firms are included.
- Households: Spend all their income on domestically produced goods and services; they do not save.
- Excluded: There is no government, taxation, imports or external trade.
- Result: There is no leakage; household consumption becomes firms’ sales revenue.
How income circulates
- Households provide factor services to firms.
- Firms pay households wages, interest, profit and rent.
- Households spend their income on firms’ goods and services.
- Firms receive this spending as sales revenue and use it to produce and pay factors again.
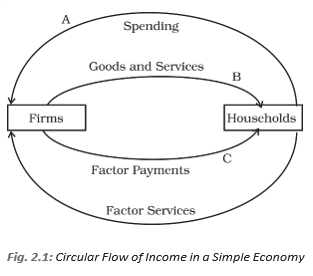
| Market | Flow from households to firms | Flow from firms to households |
|---|---|---|
| Goods and services market | Spending on goods and services | Goods and services produced by firms |
| Factor market | Factor services used in production | Factor payments: wages, interest, profit and rent |
Three Methods of Measuring National Income
Why the methods give the same total
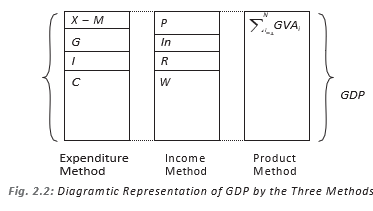
- Same flow, three views: Spending on final output becomes firms’ revenue, which is paid out as factor income.
- Equality: Aggregate expenditure equals the value of final goods and services produced, and equals aggregate factor income.
- Measurement: Since the circular flow has the same value throughout, its annual value can be measured at any of the three points.
| Method | What is measured | Point in the circular flow |
|---|---|---|
| Expenditure method | Aggregate spending received by firms for final goods and services | A |
| Product method | Aggregate value of final goods and services produced by all firms | B |
| Income method | Total factor payments: wages, interest, profit and rent | C |
Here, is aggregate expenditure, is the value of final output, and is aggregate factor income.
Higher Spending and Aggregate Income
How additional spending raises income
- Households increase their spending on firms’ output.
- Firms respond to higher demand by producing more goods and services.
- Higher production requires firms to make additional factor payments.
- Household income eventually rises by the amount needed to support the higher spending.
| Point | Individual household | Economy as a whole |
|---|---|---|
| Spending and income | Spending is normally limited by the household’s income. | Higher aggregate spending can lead firms to produce more and pay higher incomes. |
| Outcome | One worker’s extra spending does not by itself raise that worker’s income equally. | In the circular flow, higher spending can raise income throughout the economy. |
Macroeconomic Models and the General Result
Macroeconomic model — A simplified description of an imaginary economy used to highlight essential features of how an economic system works.
Using models
- Purpose: A model highlights key relationships; it does not describe every detail of a real economy.
- Caution: Simplifying assumptions should not distort the essential nature of the economy.
- Application: Economists assess which model best suits a particular real-life situation.
- General result: Even when the economy is more complex or includes saving, annual production measured by the expenditure, product or income method is the same.
Do not confuse the three methods as measuring different totals: they measure the same annual economic activity from the spending, production and income sides.
Why do the expenditure, product and income methods give the same estimate?
Name the three methods of calculating national income and state what each measures.
How can a rise in aggregate spending lead to a rise in aggregate income?
Quick recap
- Households supply factors to firms and receive wages, interest, profit and rent.
- In the simplified model, households spend all income domestically, with no saving, government or external trade.
- The circular flow links factor services, factor payments, household spending and firms’ output.
- National income can be measured by the expenditure, product or income method.
- All three methods give the same annual total because they measure one circular flow.
- Higher aggregate spending can raise production, factor payments and aggregate income.
- A macroeconomic model simplifies reality but must preserve essential economic relationships.
The Product or Value Added Method
Product Method and Double Counting
Product Method
- Product method: Estimates the economy’s annual production by adding the value added by each producer.
- Measurement: Production is valued in money, generally at market prices, over a period such as one year.
- Problem: Adding the full output value of every firm can count the same input more than once.
- Double counting: An intermediate input is counted first as the supplier’s output and again within the buyer’s output.
| Producer | Total production | Intermediate goods used | Value added |
|---|---|---|---|
| Farmer | Rs. 100 | Rs. 0 | Rs. 100 |
| Baker | Rs. 200 | Rs. 50 | Rs. 150 |
| Economy total | Rs. 300 | Rs. 50 | Rs. 250 |
Example: Why Value Added Avoids Double Counting
- Farmer: Produces Rs. 100 of wheat without intermediate inputs, so the farmer adds Rs. 100.
- Baker: Uses Rs. 50 of wheat to make bread worth Rs. 200, so the baker adds Rs. 200 − Rs. 50 = Rs. 150.
- Total: Value added is Rs. 100 + Rs. 150 = Rs. 250, not Rs. 300; the wheat sold to the baker would otherwise be counted twice.
Intermediate goods — Goods bought from another firm and completely used up in production.
Value added — A firm’s contribution to production: the value of its output minus the value of intermediate goods it uses.
Here, is the value of output and is the value of intermediate goods used by firm .
Distribution of Value Added
- Factors of production: Labour, capital, entrepreneurship and land receive wages, interest, profits and rent, respectively.
- Distribution: These factor payments together add up to the firm’s value added.
- Flow: Value added is measured over a period of time.
Gross and Net Value Added
Depreciation — The loss in the value of fixed capital due to wear and tear; it is also called consumption of fixed capital.
| Point | Gross Value Added (GVA) | Net Value Added (NVA) |
|---|---|---|
| Calculation | Output value minus intermediate goods | GVA minus depreciation |
| Capital wear and tear | Included | Excluded |
For output worth Rs. 100, intermediate goods worth Rs. 20 and depreciation of Rs. 10, GVA is Rs. 80 and NVA is Rs. 70.
Inventories and Change in Inventories
Inventory — A firm’s stock of unsold finished or semi-finished goods and unused raw materials carried from one year to the next.
Inventory Concepts
- Stock variable: Inventory is measured at a point in time, such as at the beginning or end of a year.
- Accumulation: Inventory rises when its end-of-year value exceeds its beginning value; it decumulates when it falls.
- Unused inputs: Raw materials not used up in production remain in inventory; only inputs used up are intermediate goods.
- Change: Production minus sales equals the change in a firm’s inventories.
If production is Rs. 1,000 and sales are Rs. 800, inventories increase by Rs. 200. With beginning inventory of Rs. 100, ending inventory is Rs. 300.
Identity — A relationship that is always true; the symbol denotes an identity, unlike , which may hold only for particular values.
Production and Inventory Identity
- Output identity: Production is identically equal to value added plus intermediate goods used.
- Inventory identity: Substituting the output identity gives inventory change as value added plus intermediate goods used minus sales.
- Flow variable: Change in inventories occurs over a period, so it is a flow variable.
Production equals value added plus intermediate goods used; denotes the value of intermediate goods.
Investment and Inventory Changes
Investment — An addition to a firm’s stock of capital; changes in inventories are treated as investment.
| Category | Meaning |
|---|---|
| Inventory investment | Rise in the value of a firm’s inventories over a period |
| Fixed business investment | Addition to machinery, factory buildings and equipment used by firms |
| Residential investment | Addition to housing facilities |
| Point | Planned | Unplanned |
|---|---|---|
| Cause | Production is set in advance to achieve a desired inventory level, based on expected sales. | Actual sales differ unexpectedly from what the firm expected. |
| Accumulation example | Starting with 100 shirts, produce 1,100 and sell 1,000; ending inventory is the planned 200. | Start with 100 shirts, produce 1,000 but unexpectedly sell 600; ending inventory is 500, an unplanned rise of 400. |
| Decumulation example | Start with 100 shirts, produce 925 and sell 1,000; ending inventory is the planned 25. | If sales unexpectedly reach 1,050 after producing 1,000, inventory falls by 50. |
From Firm Value Added to GDP
Output, Sales and Annual Flows
- Output and sales: Production equals sales plus the change in inventories, so output value can be calculated from sales and inventory change.
- Exports: A firm’s sales include sales to domestic buyers and buyers abroad; sales abroad are exports.
- Annual flows: Output, sales, intermediate goods, inventory change and value added are flow variables, generally measured per year.
For firm , is output value, is sales value, is the value of inventory change and is intermediate-goods value.
is depreciation of firm .
GDP is the sum of gross value added by all firms in the economy. For firms, identifies each firm.
Summation Notation
- Meaning: means add the values of for every index from through .
- Use: Summation notation expresses aggregates compactly, such as total consumption across many consumers.
Why is the sum of firms’ total production values not an accurate measure of aggregate production?
Distinguish between a stock variable and a flow variable using inventories.
Quick recap
- Value added = output value − intermediate-goods value; summing firm value added avoids double counting.
- GVA includes depreciation; NVA is GVA minus depreciation.
- Inventory includes unsold goods and unused raw materials; inventory is a stock, while its change is a flow.
- Change in inventories is identically production minus sales; inventory changes count as investment.
- Investment includes inventory investment, fixed business investment and residential investment.
- GDP is the sum of gross value added of all firms: .
Expenditure Method
Calculating GDP from Expenditure
Expenditure method — An approach to measuring GDP by adding final expenditure on goods and services produced in the economy.
Final and Intermediate Expenditure
- Final expenditure is spending on goods and services for purposes other than use as production inputs.
- Intermediate expenditure is spending on inputs used up in producing other goods; it is excluded separately to avoid double counting.
- GDP by this method is the total final expenditure received by firms in the economy.
Farmer–Baker Example
- Final spending: The baker receives Rs. 200 in final expenditure, and the farmer receives Rs. 50 in final expenditure.
- Excluded input: The baker’s Rs. 50 purchase of wheat is intermediate expenditure, so it is not added separately.
- GDP: Rs. 200 + Rs. 50 = Rs. 250 per year.
Expenditure Received by Firms
| Component | Meaning |
|---|---|
| Consumption, | Final consumption spending on the firm’s goods and services, mainly by households; firms may also buy consumables for guests or employees. |
| Investment, | Spending by other firms on the firm’s capital goods; included because these goods remain with firms, unlike intermediate inputs. |
| Government, | Government spending on the firm’s final goods and services; includes both consumption and investment expenditure. |
| Exports, | Foreign buyers’ spending on the firm’s goods and services. |
A firm’s revenue from final expenditure is the sum of its consumption, investment, government and export sales.
Adding Expenditure Across the Economy
Summing final expenditure receipts over all firms gives the economy-wide total.
Domestic Spending and Imports
- Consumption: Of total consumption expenditure , the amount spent on imported consumption goods does not go to domestic firms; domestic receipts are .
- Investment: Of total investment expenditure , the amount spent on imported investment goods is deducted; domestic receipts are .
- Government: Of total government expenditure , the amount spent on imports is deducted; domestic receipts are .
- Exports: Export expenditure is spending by foreigners on the economy’s goods and services and is received by domestic firms.
Total imports expenditure is the imported share of consumption, investment and government spending.
Add consumption, investment, government expenditure and exports, then subtract imports.
Key Implications
- Imports are subtracted so spending on foreign production is not counted as domestic GDP.
- Investment goods count as final expenditure; intermediate goods do not.
- Investment expenditure, , is the most unstable of the five variables in the GDP expenditure formula.
- Final expenditure
- Spending on final goods and services, not for use as production inputs.
- Intermediate expenditure
- Spending on goods or services used up in producing other goods; excluded as a separate GDP item.
- Investment expenditure
- Final spending on capital goods; included because the goods remain with firms.
- Imports
- Foreign-produced goods and services purchased by the economy; deducted to exclude foreign output.
In an exam explanation, state that adds foreign spending on domestic output, while is subtracted to exclude foreign output. Also identify investment expenditure as the most unstable component.
State the GDP formula under the expenditure method and explain why imports are deducted.
Quick recap
- The expenditure method calculates GDP by adding final expenditure received by firms.
- Intermediate goods are excluded separately to avoid double counting.
- Firm-level final expenditure comprises consumption, investment, government spending and exports.
- Across firms, total receipts equal the sum of each firm’s consumption, investment, government and export receipts.
- Domestic receipts exclude imported portions of consumption, investment and government expenditure.
- GDP by expenditure is ; investment expenditure is the most unstable component.
Income Method
Why the Income Method Measures GDP
Income method — A method of estimating GDP by adding the incomes earned by all factors of production.
Core idea
- Why incomes equal GDP: Firms distribute the revenue from production to factors of production as wages, profits, interest and rent.
- Coverage: Count factor incomes generated in producing final goods and services; exclude payments for intermediate goods to avoid double counting.
- Aggregate incomes: Add each household’s receipts across the economy to obtain total wages, profits, interest and rent.
Here, , , and are economy-wide totals of wages and salaries, gross profits, interest and rent, respectively.
GDP can be calculated from production, expenditure or factor incomes. In the expenditure expression, includes both planned and unplanned investment by firms.
Example: Cotton and Cloth
Production and value added
- Firm A: Produces cotton worth Rs. 50 without using raw materials and sells it to Firm B.
- Firm B: Uses the cotton to make cloth and sells the cloth to consumers for Rs. 200.
- Value added: Sales minus intermediate consumption; adding firms’ value added gives GDP.
Firm A adds Rs. 50; Firm B adds Rs. 150 after subtracting the cotton input.
| Item | Firm A | Firm B |
|---|---|---|
| Sales | 50 | 200 |
| Intermediate consumption | 0 | 50 |
| Value added | 50 | 150 |
The firms’ value added totals Rs. 200.
GDP by the expenditure method
- Final expenditure: Consumers spend Rs. 200 on the finished cloth.
- GDP: Only the cloth bought for end use is counted; the cotton input is intermediate consumption and is not counted separately.
GDP by the Income Method
| Factor income | Firm A | Firm B | Total |
|---|---|---|---|
| Wages | 20 | 60 | 80 |
| Profits | 30 | 90 | 120 |
Total factor income is wages plus profits: Rs. 80 + Rs. 120 = Rs. 200.
- The same GDP is obtained by adding value added, final expenditure or factor incomes.
- In the example, each method gives GDP = Rs. 200.
How is GDP calculated using the income method?
Show that the three methods give the same GDP in the cotton-and-cloth example.
Quick recap
- The income method totals factor incomes generated by production.
- GDP by income equals wages and salaries plus gross profits, interest and rent.
- GDP by production, expenditure and income methods are equivalent measures.
- Value added equals sales minus intermediate consumption.
- In the example, production, expenditure and income each give GDP of Rs. 200.
Factor Cost, Basic Prices and Market Prices
India’s National Income Measures
- Earlier focus: GDP at factor cost was India’s most highlighted measure of national income.
- CSO revision: In January 2015, the Central Statistics Office (CSO) replaced GDP at factor cost with GVA at basic prices.
- Current focus: GDP at market prices—now generally called GDP—is the most highlighted measure. The CSO releases GVA at basic prices and GDP at market prices.
- January 2015The CSO replaced GDP at factor cost with GVA at basic prices; GDP at market prices became the most highlighted measure.
GVA and the Three Price Measures
Gross Value Added (GVA) — The value of total output produced minus the value of intermediate consumption used to produce further output.
- Intermediate consumption: Goods and services used to produce other output, rather than for final consumption.
- Price distinctions: Factor cost, basic prices and market prices differ according to which production and product taxes or subsidies are included.
| Point | Production taxes/subsidies | Product taxes/subsidies |
|---|---|---|
| Basis | Related to production; independent of its volume | Charged or received per unit of a product |
| Examples | Land revenue; stamp and registration fees | Excise tax; service tax; export and import duties |
| Net amount | Production taxes less production subsidies | Product taxes less product subsidies |
| Point | Factor cost | Basic prices | Market prices |
|---|---|---|---|
| What is included? | Payments to factors of production only | Factor cost plus net production taxes | Basic prices plus net product taxes |
| Taxes included | No taxes | Production taxes, less production subsidies | Production and product taxes, less their respective subsidies |
| Taxes excluded | Production and product taxes | Product taxes, less product subsidies | None of the listed net taxes |
Net production taxes equal production taxes less production subsidies.
Net product taxes equal product taxes less product subsidies.
Moving from Factor Cost to Market Prices
- GVA at factor cost
- Add net production taxes → GVA at basic prices
- Add net product taxes → GVA at market prices
Do not treat production taxes and product taxes as interchangeable: basic prices include net production taxes but exclude net product taxes.
Quick recap
- GVA equals total output less intermediate consumption.
- Factor cost includes payments to production factors and excludes taxes.
- Net production taxes are production taxes minus production subsidies.
- GVA at basic prices equals GVA at factor cost plus net production taxes.
- Net product taxes are product taxes minus product subsidies.
- GVA at market prices equals GVA at basic prices plus net product taxes.
- In January 2015, the CSO replaced GDP at factor cost with GVA at basic prices; GDP at market prices is now the most highlighted measure.
Some Macroeconomic Identities
From GDP to GNP
Gross Domestic Product at market prices (GDPₘₚ) — The market value of final goods and services produced within a country's domestic territory during a year, regardless of who owns the factors of production.
Why GDP and GNP differ
- GDP counts production within the domestic territory, including production by foreign-owned firms.
- GNP adjusts GDP for factor income flowing between the country and the rest of the world.
- Example: A Hyundai factory's production in India is part of India's GDP, but profits accruing to its foreign owners are deducted when calculating India's GNP.
- Example: Wages earned abroad by an Indian resident are included in India's GNP adjustment, although the production is part of the host country's GDP.
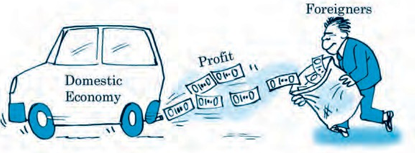
Net Factor Income from Abroad (NFIA) — Factor income earned by domestic factors abroad minus factor income earned by foreign factors within the domestic economy.
GNP adds net factor income from abroad to GDP.
Gross and Net Measures; Market Prices and Factor Cost
Depreciation — The loss in the value of fixed capital during a year due to wear and tear; it does not become anyone's income.
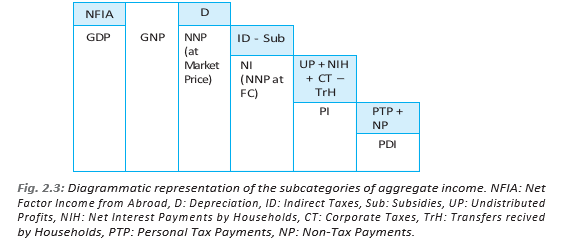
Deduct depreciation from GNP to obtain NNP.
Market price to factor cost
- Market price is the price paid by buyers and includes taxes on products, after allowing for subsidies.
- Factor cost is the amount received by producers for supplying factors of production.
- Net indirect taxes equal indirect taxes minus subsidies; deduct them from market-price value to obtain factor-cost value.
- Effect: Indirect taxes raise market prices but accrue to government; subsidies lower market prices, so they are added back in the conversion.
National Income is NNP at factor cost.
Personal Income and Personal Disposable Income
From National Income to Personal Income
- Undistributed profits (UP) are firms' profits not distributed to households; subtract them from NI.
- Corporate tax is paid on firms' earnings and does not accrue to households; subtract it.
- Net interest paid by households to firms and government is deducted.
- Transfer payments received by households from government and firms—such as pensions, scholarships and prizes—are added.
PI is the income received by households before their personal taxes and other non-tax payments.
From Personal Income to Disposable Income
- Personal tax payments include personal income tax.
- Non-tax payments include fines.
- Personal Disposable Income (PDI) is the income households can allocate between consumption and saving.
Other Income Aggregates
National Disposable Income — The maximum amount of goods and services available to the domestic economy, including current transfers from abroad.
Other current transfers from abroad include gifts and aid.
Private income combines income accruing to the private sector with specified interest and transfer receipts.
Basic National Income Aggregates
| Aggregate | Meaning / relationship |
|---|---|
| GDP at market prices () | Final output produced within domestic territory; includes residents and non-residents. . |
| GDP at factor cost () | Domestic output valued at factor cost. . |
| NDP at market prices () | GDP at market prices less depreciation. . |
| NDP at factor cost () | Factor income generated within domestic territory. . |
| GNP at market prices () | Output of a country's normal residents, whether at home or abroad. . |
| GNP at factor cost () | GNP valued at factor cost. . |
| NNP at market prices () | GNP less depreciation. Also . |
| NNP at factor cost () | National income: income earned by factors belonging to the country. . |
| GVA at market prices () | Gross Value Added at market prices; equal to . |
| GVA at basic prices () | GVA at market prices less net product taxes. . |
| GVA at factor cost () | GVA at basic prices less net production taxes. . |
Do not confuse domestic with national: GDP is based on where production occurs; GNP is based on the income of a country's normal residents, wherever they produce.
How is National Income obtained from NNP at market prices?
How does Personal Income differ from Personal Disposable Income?
Quick recap
- GDP measures production within domestic territory; GNP adjusts GDP by adding NFIA.
- NFIA is domestic factor income from abroad minus foreign factor income earned domestically.
- Subtract depreciation from a gross measure to obtain the corresponding net measure.
- Convert market prices to factor cost by deducting net taxes; subsidies are deducted from taxes to find net taxes.
- National Income is NNP at factor cost; PI adjusts NI for undistributed profits, corporate tax, interest and transfers.
- PDI is PI less personal taxes and non-tax payments; households divide it between consumption and saving.
- National Disposable Income includes other current transfers from the rest of the world.
Nominal And Real GDP
Why distinguish nominal and real GDP?
Why GDP values can mislead
- GDP can rise because production increased, prices increased, or both.
- Comparison problem: If GDP doubles while production stays unchanged, a doubling of prices alone could explain the rise.
| Measure | Nominal GDP | Real GDP |
|---|---|---|
| Meaning | GDP valued at current prevailing prices. | GDP valued at prices fixed from a chosen base year. |
| What a change reflects | Changes in both prices and production volume. | Changes in production volume, since prices are held constant. |
| Best use | Measures GDP at current prices. | Compares production over time or across countries more reliably. |
Use current-year quantities, , and base-year prices, , to calculate real GDP.
| Year | Bread produced | Price per unit | Nominal GDP | Real GDP at 2000 prices |
|---|---|---|---|---|
| 2000 | 100 units | Rs. 10 | Rs. 1,000 | Rs. 1,000 |
| 2001 | 110 units | Rs. 15 | ; Rs. 1,650 | ; Rs. 1,100 |
Reading the example
- Base year: 2000 is the base year because its prices are used to calculate real GDP.
- Interpretation: In 2001, nominal GDP rises partly because bread costs more; real GDP isolates the increase in bread production.
GDP Deflator
GDP deflator — A price index showing how the price level of domestically produced output has changed relative to the base year.
What the ratio shows
- Why it reflects prices: Nominal and real GDP for a given year use the same production volume; their difference comes from the current-year versus base-year prices.
- Interpretation: A higher deflator means the price level is higher than in the base year.
- Related index: A GNP deflator can be calculated in the same way using nominal and real GNP.
The ratio compares nominal GDP, , with real GDP, ; multiply by to express it as a percentage.
Use this form when the deflator is expressed as a percentage index.
Bread example
- Calculation: , or .
- Meaning: The 2001 price level is times the 2000 level; bread's price rose from Rs. 10 to Rs. 15.
Consumer Price Index (CPI)
Consumer Price Index (CPI) — An index measuring the cost of a fixed basket of goods and services bought by a representative consumer.
How CPI is calculated
- Basket: Keep the quantities of the representative consumer's goods fixed.
- Base-year cost: Find the cost of that basket at base-year prices.
- Current-year cost: Price the same basket using current-year prices; express this cost as a percentage of the base-year cost.
For a fixed basket, is the quantity of good , and and are its current-year and base-year prices. CPI is generally expressed as a percentage.
| Good | Fixed quantity | 2000 price | Basket cost in 2000 | 2005 price | Basket cost in 2005 |
|---|---|---|---|---|---|
| Rice | 90 kg | Rs. 10 per kg | Rs. 900 | Rs. 15 per kg | Rs. 1,350 |
| Cloth | 5 pieces | Rs. 100 per piece | Rs. 500 | Rs. 120 per piece | Rs. 600 |
| Total | — | — | Rs. 1,400 | — | Rs. 1,950 |
CPI example result
- Calculation: .
- Interpretation: The fixed basket costs about of its 2000 cost in 2005.
Wholesale Price Index and comparison of price indices
Retail and wholesale prices
- Retail price: The price paid by the consumer; it may include traders' margins.
- Wholesale price: The price at which goods are traded in bulk; raw materials and semi-finished goods are commonly traded this way.
- WPI: The Wholesale Price Index tracks wholesale prices. In the United States, a similar index is called the Producer Price Index (PPI).
| Point | CPI | GDP deflator |
|---|---|---|
| Coverage | Prices of goods and services bought by the representative consumer. | Prices of all goods and services produced in the country. |
| Imported goods | Includes imported goods if they are part of the consumer's basket. | Excludes imports because they are not produced domestically. |
| Weights | Quantities in the consumer basket are fixed. | Weights change according to each good's production level. |
Why is real GDP more useful than nominal GDP for comparing production over time?
State three differences between CPI and the GDP deflator.
Quick recap
- Nominal GDP values output at current prices; real GDP values it at base-year prices.
- Real GDP is the better measure for comparing changes in production volume.
- GDP deflator equals nominal GDP divided by real GDP; multiply by 100 for a percentage index.
- CPI compares the current and base-year costs of the same fixed consumer basket.
- WPI tracks wholesale prices; PPI is a similar index used in the United States.
- CPI and the GDP deflator differ in coverage, treatment of imports, and weighting.
GDP And Welfare
GDP as an Indicator of Welfare
Gross Domestic Product (GDP) — The total value of goods and services produced within a country's geographical boundaries during a particular year.
- Income link: GDP is distributed among people as incomes, except for retained earnings.
- Possible welfare link: Higher income can enable people to buy more goods and services, improving material well-being.
- Price changes: Real GDP adjusts for price changes and is more useful than nominal GDP for comparing output over time.
- Main limitation: Even real GDP does not show how evenly income is distributed or capture every factor affecting welfare.
Unequal Distribution of GDP
Unequal distribution of GDP — A situation in which the income generated in an economy is concentrated among some people or firms, rather than shared uniformly.
- Unequal gains: GDP can rise because a small group gains substantially even while incomes fall for most people.
- Welfare implication: A higher total does not prove that most people are better off.
| Year | Income distribution | Total income |
|---|---|---|
| 2000 | 100 people earn Rs. 10 each | Rs. 1,000 |
| 2001 | 90 people earn Rs. 9 each; 10 earn Rs. 20 each | Rs. 1,010 |
All incomes are in rupees. With prices unchanged, GDP rose by Rs. 10, although 90% of people lost 10% of their income and 10% gained 100%.
Non-monetary Exchanges
Barter exchange — The direct exchange of goods or services for other goods or services without using money.
- Unpaid domestic work: Household services, including services performed by women at home, are generally not valued in money and are excluded from GDP.
- Barter and GDP: Barter exchanges are not recorded as monetary transactions, so they are generally left out of standard GDP calculations.
- Where it occurs: Barter is found in some remote, underdeveloped regions of developing countries.
- Limitation: Excluding unpaid work and barter can underestimate productive activity and gives an incomplete picture of welfare.
Externalities
Externality — A benefit or harm caused by a firm or individual to others for which no payment is made or penalty is imposed.
- No market price: Externalities do not have a market where their effects can be bought and sold.
- Negative externality: An uncompensated harmful effect; if GDP omits the harm, it can overestimate actual welfare.
- Positive externality: An uncompensated beneficial effect; if GDP omits the benefit, it can underestimate actual welfare.
A refinery's value added is its output value minus the value of intermediate goods used, such as crude oil; this value added is included in GDP.
Negative Externality: Refinery Pollution
- A refinery produces oil; the value added from this production is counted in GDP.
- The refinery pollutes a nearby river but does not bear the full cost of the pollution.
- Pollution harms people using the river water and can kill fish and other organisms.
- Fishermen may lose their livelihood, reducing their well-being.
- GDP does not include these harms, so it can overestimate actual welfare.
- Real GDP
- GDP adjusted for changes in prices.
- Barter exchange
- Direct exchange of goods or services without money.
- Negative externality
- An uncompensated harmful effect on others.
- Positive externality
- An uncompensated beneficial effect on others.
Why may a rise in GDP fail to show improved welfare for most people?
How do externalities affect GDP as a measure of welfare?
Quick recap
- GDP measures domestic production, but it is not a complete measure of people's welfare.
- Real GDP adjusts for price changes but does not reveal the distribution of income.
- GDP can rise even when most people become worse off if gains are concentrated among a few.
- Unpaid domestic work and barter exchanges may be excluded from GDP.
- Negative externalities such as pollution can make GDP overstate welfare.
- Positive externalities can make GDP understate welfare.
Summary & Key Concepts
Circular Flow of Income
How the circular flow works
- Households → firms: Households supply factors of production, such as labour and capital.
- Firms → households: Firms pay factor incomes, including wages, rent, interest and profit.
- Firms → households: Firms produce goods and services that households purchase.
- Expenditure becomes income: Household spending on firms’ output returns to firms as revenue.
- Three measures: The same circular flow can be measured through production, factor income or expenditure.
- Flow and stock: A flow is measured over a period; a stock is measured at a point in time.
| Concept | Meaning | Example |
|---|---|---|
| Flow | Measured over a period of time. | Income per year |
| Stock | Measured at a particular point in time. | Wealth on a specific date |
Methods of Measuring National Income
| Method | What is added | Key caution |
|---|---|---|
| Product | Final output or value added | Exclude intermediate goods to prevent double counting. |
| Income | Factor payments earned from production, such as wages, rent, interest and profit | Exclude transfer payments; they are not payments for current production. |
| Expenditure | Spending on final goods and services produced in the economy | Include investment goods and inventory changes as well as consumption. |
Value added — A producer’s output value minus the value of intermediate goods used to make it.
Here, is value added, is value of output and is the value of intermediate consumption.
Expenditure, Investment and Inventories
Expenditure components and investment
- Consumption goods: Bought by households for current use; they include consumer durables and non-durables.
- Capital goods: Used to produce other goods and services; their purchase adds to productive capacity.
- Gross investment: Includes purchases of new capital goods and changes in inventories.
- Net investment: Gross investment after allowing for depreciation, the wear and tear of fixed capital.
- Inventory change: Output added to inventories counts as current production even if it remains unsold.
Here, is consumption, investment, government purchases, exports and imports.
Depreciation is the value of fixed capital used up in production.
Aggregate Income Concepts
Domestic and national product
- Market price: Includes indirect taxes and subsidies in the price paid by buyers.
- Factor cost: Measures the cost of factor services; subtract net indirect taxes from market-price values to convert to factor cost.
- Net factor income from abroad (NFIA): Factor income received from abroad minus factor income paid abroad.
- Depreciation: Subtract the value of fixed capital used up in production to move from a gross to a net aggregate.
| Aggregate | Meaning or relationship |
|---|---|
| GDP at market price | Value of final output produced within domestic territory. |
| GNP at market price | |
| NNP at market price | |
| NNP at factor cost (National Income) | |
| Net indirect taxes | Indirect taxes minus subsidies. |
| National Disposable Income | National income available for consumption and saving, including net current transfers from abroad. |
Personal Income and Disposable Income
Income received by households
- Personal Income (PI): Start with national income; subtract corporate tax, undistributed profits and net interest payments made by households, then add transfer payments received by households.
- Transfer payments: Payments from government or firms to households that are not made in return for current production.
- Personal Disposable Income (PDI): Personal income remaining after personal tax payments and non-tax payments.
- Use of PDI: Available to households for consumption and saving.
Here, is national income, corporate tax, undistributed profits, net interest payments made by households and transfer payments received by households.
Here, is personal taxes and is non-tax payments.
Nominal GDP, Real GDP and Price Indices
Output and price-level measures
- Base year: The reference year whose prices are used to calculate real GDP and price indices.
- GDP deflator: A broad price index for domestically produced final goods and services.
- CPI: Tracks prices of a representative basket of goods and services purchased by consumers.
- WPI: Tracks prices of goods at the wholesale level.
- Index reading: Price indices compare prices with the base year; an index of indicates the base-year price level.
Here, is nominal GDP and is real GDP.
Use the GDP deflator, denoted by , to convert nominal GDP into real GDP.
Here, is the cost of the basket in the current year and is its cost in the base year.
| Point | CPI | WPI | GDP Deflator |
|---|---|---|---|
| Coverage | Consumer basket | Goods at wholesale level | Final goods and services produced domestically |
| Main use | Measures consumer price changes | Measures wholesale price changes | Measures price changes in domestic output |
| Imports | Can include imported consumer goods | Can include imported goods | Excludes imports; includes domestically produced exports |
GDP and Economic Welfare
Limits of GDP as a welfare measure
- Externalities: Effects of production or consumption on others that may not be reflected in market prices.
- Limitations: GDP may not show income distribution, unpaid work, leisure, environmental damage or quality of life.
- Conclusion: GDP growth can indicate increased production, but GDP is not a complete index of economic welfare.
Why must intermediate goods be excluded or adjusted for in the product method?
Distinguish GDP from GNP.
Why is GDP not a complete measure of economic welfare?
Quick recap
- Production, factor income and expenditure measure the same circular flow of economic activity.
- Exclude intermediate goods or use value added to avoid double counting.
- Gross investment includes inventory change; net investment subtracts depreciation.
- GNP adjusts GDP for NFIA; net aggregates subtract depreciation, and factor-cost values adjust for net indirect taxes.
- PI accounts for household receipts and deductions; PDI subtracts personal taxes and non-tax payments.
- Real GDP uses base-year prices; CPI, WPI and the GDP deflator track different price coverage.
- GDP measures output, not every dimension of economic welfare.
Economics — ALL CHAPTERS
1
Indian Economy On The Eve Of Independence
2
Indian Economy 1950–1990
3
Liberalisation, Privatisation And Globalisation: An Appraisal
4
Human Capital Formation In India
5
Rural Development
6
Employment : Growth, Informalisation And Other Issues
7
Environment and Sustainable Development
8
Comparative Development Experiences of India And Its Neighbours
1
Introduction
2
National Income Accounting
3
Money and Banking
4
Determination of Income and Employment
5
Government Budget and the Economy
6
Open Economy Macroeconomics