Class 6 . Mathematics . Ganita Prakash . Data Handling and Presentation
Chapter 4: Data Handling and Presentation
Ch 4
Mathematics
Class 6
Introduction
Data
Data — A collection of facts, numbers, measurements, observations or descriptions that conveys information is called data.
Examples and purpose
- Examples: A list of classmates’ favourite colours and the measured weights of students are both data.
- Purpose: Data gives information about the things it describes.
- Data handling: Data can be presented, interpreted and used to make inferences.
Is a class list of favourite colours data? Explain.
- A teacher records the favourite colours of every student in a class.
- The recorded list is data because it collects observations and gives information about the students’ preferences.
A list gives the heights of all students in a class. Is it data? Why?
Give one example of data about the students in your class.
Quick recap
- Data is a collection of information-bearing facts, numbers, measurements, observations or descriptions.
- A class’s favourite-colour list is an example of data.
- Recorded student weights are another example of data.
- Data conveys information about the things it describes.
- Data handling includes presenting and interpreting data and making inferences from it.
Collecting and Organising Data Part-1
Collecting and organising data
Frequency — The frequency of a choice is the number of times it appears in the collected data.
Use this to check that all responses have been counted.
Finding the most popular choice
- List the different answers or categories.
- Count how many times each category occurs; these counts are its frequencies.
- Compare the frequencies and select the category with the greatest count.
- Check that the frequencies add up to the total number of responses.
| Game | Frequency |
|---|---|
| Hockey | 8 |
| Kabaddi | 6 |
| Cricket | 6 |
| Satoliya (Pittu) | 5 |
| Football | 4 |
| Badminton | 2 |
| Total | 31 |
Which is the most popular game among the classmates, and how many students chose it?
- Compare the game frequencies in the table.
- The greatest frequency is for hockey.
- Therefore, hockey is the most popular game; the total count is consistent.
Do not guess the most popular choice from a few opinions; collect responses from the group and compare the frequencies.
When is data collection needed?
| Point | Needs data collection | Does not need data collection |
|---|---|---|
| Example | Most popular TV show among classmates | When India became independent |
| Example | Amount of water wasted in a locality | Capital of India |
| Reason | Requires information from people or measurements in that group or place | Can be answered using an already established fact |
In the game data, how many students chose cricket, and how many more chose hockey than football?
Which question needs data collection: “What is the capital of India?” or “What is the most popular TV show among classmates?”
Quick recap
- Data is information gathered to answer a question.
- Collect responses from the relevant group or place when the answer depends on them.
- Organise the responses by category and count each category's frequency.
- The category with the greatest frequency is the most popular choice.
- Check that the sum of all frequencies equals the total number of responses.
- In the class game survey, hockey was most popular with a frequency of 8.
Collecting and Organising Data Part-3
Tally Marks and Frequency
Frequency — The frequency of a category is how many times that category occurs in the data.
Use this to record the count for each category.
Making a Frequency Table
- List each category that can occur in the data.
- Record one tally for each response, grouping tallies in fives.
- Count the tallies in each category and enter the total as its frequency.
Find the frequencies from the sweet tally table, and check whether the rasgulla tally agrees with the stated answer.
- Read the sweet tallies and add the groups of marks.
- For rasgulla, the tally shown totals six; the source answer key states seven, so the two source entries conflict.
Do not report rasgulla as an unambiguous answer: its tally, , gives , while the source answer key gives . The table records totals only, not each student's choice.
Recording Individual Choices
- To distribute an item to the correct person, record each student's name with their choice.
- Use a frequency table when only the total choosing each category is needed.
Arranging Data in Order
Ordered data — Ordered data is a list of observations arranged in ascending or descending order.
Add the frequencies of all values that satisfy the condition.
Organising a List of Observations
- Arrange observations in ascending or descending order.
- Read the smallest and largest values from the ends of the list.
- Count each repeated value, or organise the counts in a frequency table.
From the shoe-size data, find the smallest and largest sizes, the number wearing size , and the number wearing a size larger than .
- The ordered shoe sizes range from the first value to the last.
- Read the frequency of shoe size five from the frequency table.
- For sizes larger than four, add the frequencies for sizes five, six, and seven.
Choosing a Suitable Organisation
- Tree observations A frequency table can show how many of each tree type are seen along a route; the largest and smallest counts identify the most and least common trees.
- Letter counts Count selected letters in a news item in a frequency table; compare their counts to find the most and least frequent.
- Comparing articles The order of letter frequencies can differ by article. In English news items, the order is likely to be similar because these letters occur at different rates in English text.
- Choose a format Use an arrangement that makes the question easy to answer; frequency tables help compare categories.
The observations are . Find the frequency of each value.
A table shows that students chose one sweet and chose another. Can it tell you which sweet each named student chose?
Quick recap
- A tally records one response; every fifth mark groups four earlier marks.
- Frequency is the number of observations in a category.
- The rasgulla tally totals , but the source answer key says ; these entries conflict.
- A frequency table shows category totals, not which individual made each choice.
- Ascending order arranges observations from smallest to largest and makes comparisons easier.
- Add the frequencies of all categories that meet a condition, such as shoe sizes larger than .
Pictographs Part-1
Understanding and Reading Pictographs
Pictograph — A pictograph shows data using pictures or symbols, with a key stating how many items each symbol represents.
Key features
- Key: Tells how many people or objects each symbol represents.
- One-to-one scale: One symbol can represent one item, such as one face for one student.
- Larger scale: One symbol can represent several items, such as one triangle for children.
- Partial symbols: A half-symbol represents half the amount given by the key.
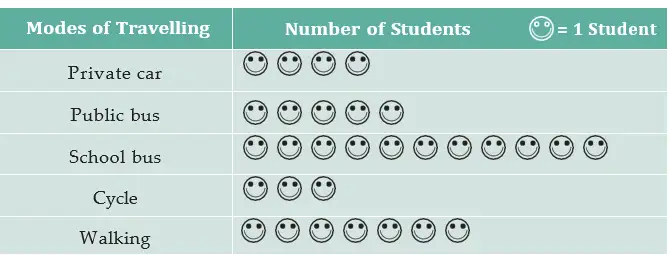
The number of items is the number of symbols multiplied by the value of each symbol.
Use when a pictograph’s key gives the value of each symbol.
Find a total from a pictograph
- Read the key to find the value of one symbol.
- Count the full and partial symbols for the category.
- Multiply the symbol count by the key value.
- Compare the totals to identify the greatest or least category.
How many students were absent in Class VIII?
- A pictograph uses one face for one absent student. Class VIII has seven faces.
- Multiply the number of faces by the value of each face.
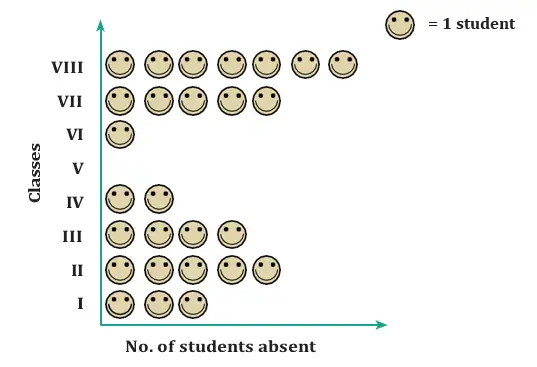
Do not count symbols without checking the key. The sleep-data table lists , , and children; with a key of children per symbol, these correspond to , , and symbols. The source’s accompanying worked counts differ, so use the stated data and key consistently.
Choosing a Scale and Drawing a Pictograph
Scale — The scale is the number of items represented by one symbol in a pictograph.
Choosing a useful scale
- Many items: A symbol for every person may require too many symbols and take too much space.
- Larger key: Choose a symbol value that keeps the pictograph clear and manageable.
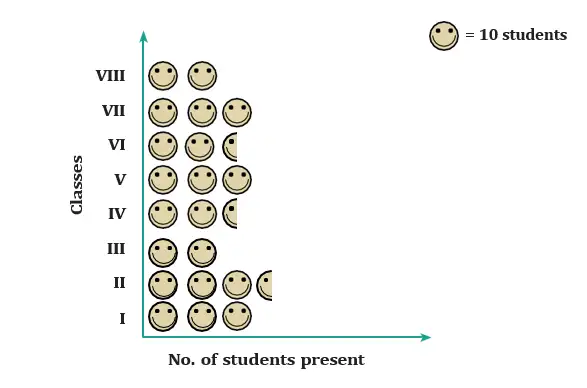
- Partial symbol: A key of can represent students with symbols; a key of needs full symbols and half-symbol.
- Exact representation: The chosen key and allowed fractions must represent every data value exactly.
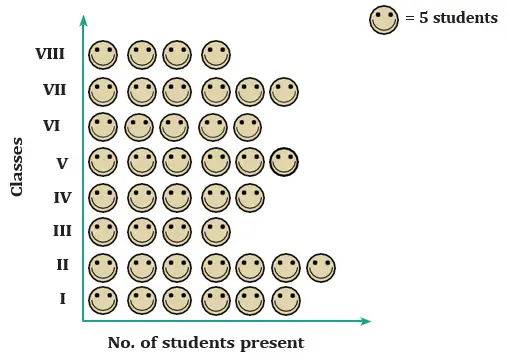
| Class | I | II | III | IV | V | VI | VII | VIII |
|---|---|---|---|---|---|---|---|---|
| Students present | 30 | 35 | 20 | 25 | 30 | 25 | 30 | 20 |
Prepare a pictograph
- List each category and its data value.
- Choose a scale that makes the symbol counts manageable.
- Convert each value into full and, if needed, partial symbols.
- Write a clear key and label the categories.
How many symbols represent the 35 students in Class II?
- Use one symbol for every five students. Class II has 35 students.
- Divide the number of students by the value of one symbol.
- Draw seven symbols for Class II and label the key as one symbol equals five students.
If one symbol represents items and only half-symbols are allowed, each category must be a multiple of ; values such as or cannot be shown exactly.
With one symbol representing 10 children, how many children are shown by two full symbols and one half-symbol?
Can a key of one symbol for 10 students, using only full and half-symbols, show 33 or 27 students exactly?
Quick recap
- A pictograph represents data with pictures or symbols.
- Always read the key to know the value of each symbol.
- Multiply the number of symbols by the key value to find a total.
- A half-symbol represents half the key value.
- Choose a scale that is clear, manageable, and represents every value exactly.
- A scale of 10 with half-symbols represents multiples of five, not 33 or 27.
Pictographs Part-2
Reading and Preparing Pictographs
Pictograph — A pictograph represents data using pictures or symbols, with a key showing what each symbol stands for.
Key Features
- Layout: Categories may be arranged horizontally or vertically, with symbols placed in the matching rows or columns.
- Key or scale: A symbol may represent one item or several items; check the key before counting.
- Quick reading: Compare symbol counts to identify the most and least frequent categories and make simple inferences.
- Large or uneven data: A pictograph can be harder to prepare when quantities are large or do not match the scale exactly.
Let be the number of symbols, the category frequency, and the value of one symbol. Use a part-symbol when needed.
Let be the symbol count and the value represented by each symbol.
Read or Prepare a Pictograph
- To read a pictograph, find the key and count the symbols for the category.
- Multiply the symbol count by the value represented by one symbol to find the frequency.
- To prepare a pictograph, choose a key and draw the required full or partial symbols for each category.
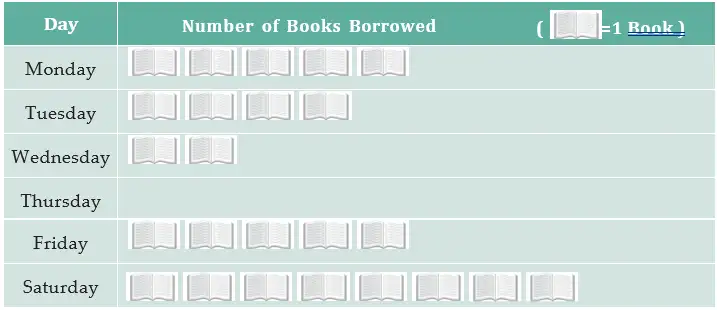
Use the library pictograph to find the day with the fewest and most books borrowed, and the weekly total.
- The fewest books were borrowed on Thursday.
- The total number of books borrowed during the week was 24.
- The most books were borrowed on Saturday; students may have borrowed them to read on Sunday, a holiday.
Pictograph with a Scale of 100 Kites
| Shopkeeper | Kites sold |
|---|---|
| Chaman | |
| Rani | |
| Rukhsana | |
| Jasmeet | |
| Jetha Lal | |
| Poonam Ben |
Representing the Kite Data
- Key: One full kite symbol represents kites.
- Partial symbol: Half a kite symbol represents kites.
- Examples: Rani's kites need symbols; Chaman's kites need symbols.
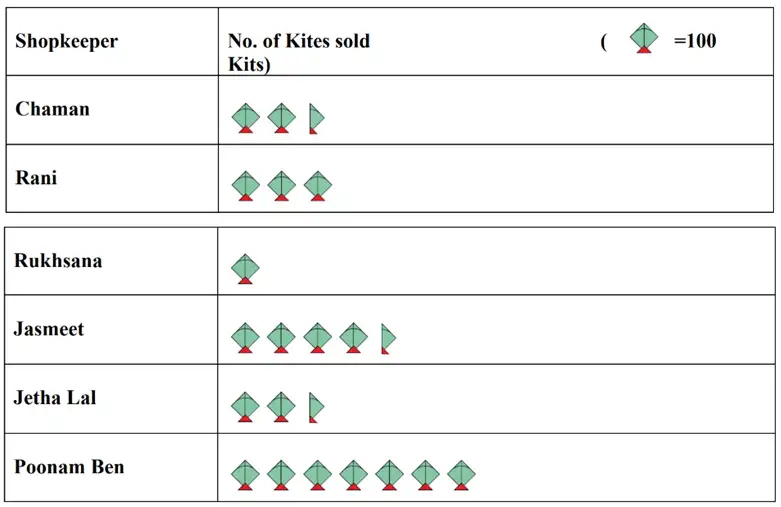
How many symbols represent Rani's purchase, and who bought the most kites?
Who bought more kites, Jasmeet or Chaman? Did Poonam Ben buy more than twice Rani's number?
Do not count symbols without checking the key. With a scale of 100 kites per symbol, 250 kites require two and a half symbols, not two.
Quick recap
- A pictograph represents categories using pictures or symbols.
- Always check the key before counting or comparing symbols.
- Frequency equals symbol count multiplied by the value of one symbol.
- Use part of a symbol when a quantity is not an exact multiple of the key.
- Pictographs make it easy to identify the greatest, least, and total frequencies.
Bar Graphs Part-1
Understanding Bar Graphs
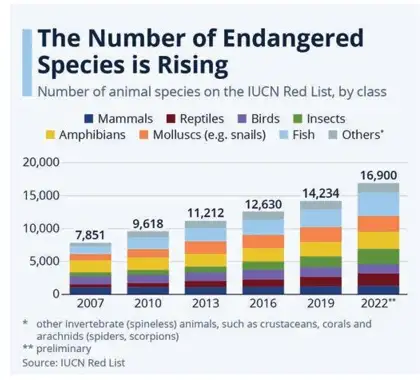
Bar graph — A bar graph represents values for different categories using bars whose lengths or heights show the values.
Bar graphs make it easy to compare categories and identify the largest, smallest, or zero values. Bars have uniform width and equal spacing; they may be horizontal or vertical. Equal intervals on the numerical axis must represent equal increases in value. A zero value has no visible bar. For large frequencies, a scale or key can be used.
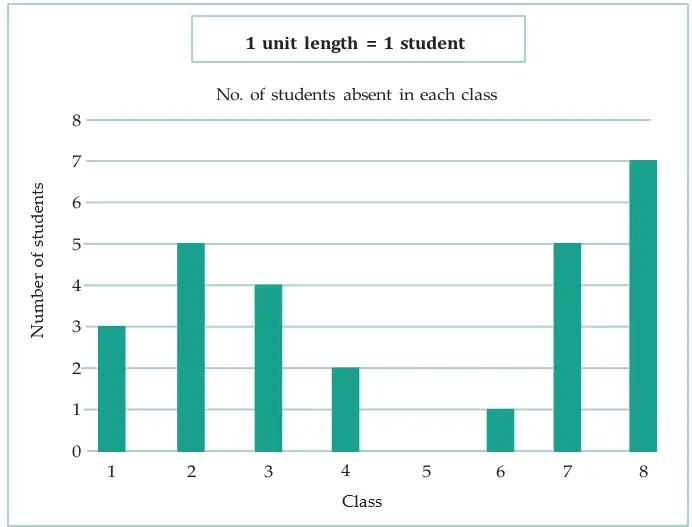
| Class | I | II | III | IV | V | VI | VII | VIII |
|---|---|---|---|---|---|---|---|---|
| Students absent | 3 | 5 | 4 | 2 | 0 | 1 | 5 | 7 |
The length or height of a bar represents its category's value. For large values, use a consistent scale or key.
Making a bar graph
- Mark the categories on one axis.
- Mark values on the other axis using equal intervals and a suitable scale or key.
- Draw equal-width bars with equal gaps; set each bar’s length or height to its value.
- Label both axes and give the graph a clear title.
Using the absent-students data, which class had the most absences, and which class had full attendance?
- List the absences in class order.
- Find the greatest value; it belongs to Class VIII.
- The zero value shows that Class V had full attendance.
How many students were absent in Class II?
Which classes had 5 students absent?
What does equal spacing between consecutive numbers on the value axis tell you?
Do not use unequal gaps between values on the numerical axis: equal visual intervals must represent equal increases in value.
Quick recap
- Bar graphs use bars to show values for different categories.
- Bars have uniform width and equal spacing, and may be horizontal or vertical.
- The length or height of each bar represents its value.
- Equal intervals on the value axis must represent equal increases.
- A zero value has no visible bar; large frequencies can be shown using a scale or key.
- Bar graphs make comparisons, such as finding the highest or lowest category, quick.
Bar Graphs Part-2
Reading and Interpreting Bar Graphs
Bar graph — A bar graph represents data with bars whose lengths show the values for different categories or time periods.
The longest bar represents the greatest value, and the shortest bar represents the least value. Use the graph’s scale to convert bar length into the actual quantity.
Multiply the number of units in the bar by the quantity represented by one unit.
How to read a bar graph
- Read the category or time interval named beside the bar.
- Count the bar’s units and check how much each unit represents.
- Multiply to find the value; compare bars or add values when needed.
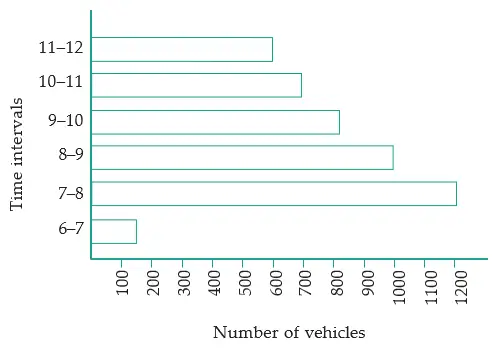
Traffic graph observations
- Maximum traffic: The longest bar is for 7–8 a.m., with 1,200 vehicles.
- Next highest: The 8–9 a.m. bar represents 1,000 vehicles.
- Minimum traffic: The shortest bar is for 6–7 a.m., with about 150 vehicles.
- Next lowest: The 11 a.m.–12 noon bar represents about 600 vehicles.
- Total: About 4,450 vehicles passed the crossing from 6 a.m. to noon.
- Possible reasons: Traffic may be low early in the morning, peak during the morning rush, then fall as people reach their destinations.
How many vehicles passed the crossing from 8 a.m. to 10 a.m.?
- Find the total vehicles from 8 a.m. to 10 a.m. using the bars for 8–9 a.m. and 9–10 a.m.
- Add the two hourly values.
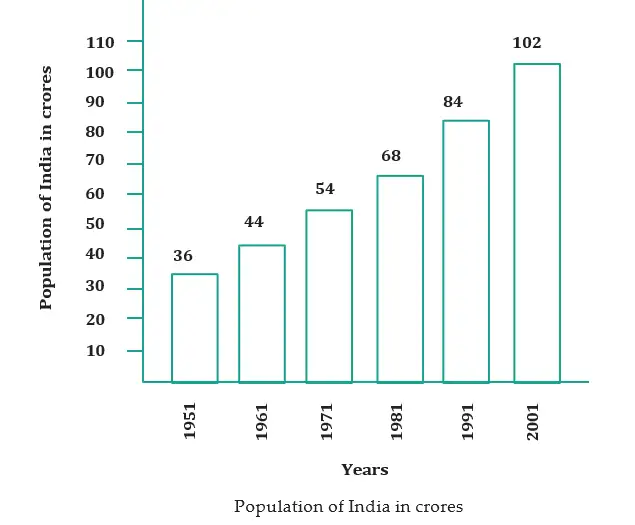
Choosing and using a scale
- Why use a scale? A scale makes large quantities manageable to show as bar lengths.
- Population graph scale: One unit represents 10 crore people.
- Conversions: A bar of 5 units represents 50 crore; a bar of 8 units represents 80 crore.
- Comparisons over time: Subtract two decade values to find the increase over that period; subtract the 1951 value from the 2001 value for the total increase over 50 years.
On the population graph, what population does a bar of 8 units represent?
How many more vehicles passed from 7–8 a.m. than from 8–9 a.m.?
Which interval had the least traffic, and about how many vehicles passed then?
Do not treat the bar’s length as the actual quantity unless one unit represents one item; always apply the stated scale.
Quick recap
- A bar’s length shows the value for its category or time interval.
- Use the graph’s scale to convert bar units into actual quantities.
- The longest and shortest bars show the maximum and minimum values.
- Add bar values to find totals across intervals.
- Subtract values to find differences or increases between years.
- India’s population graph uses one unit to represent 10 crore people.
Drawing a Bar Graph Part-1
Sweet Preference Data
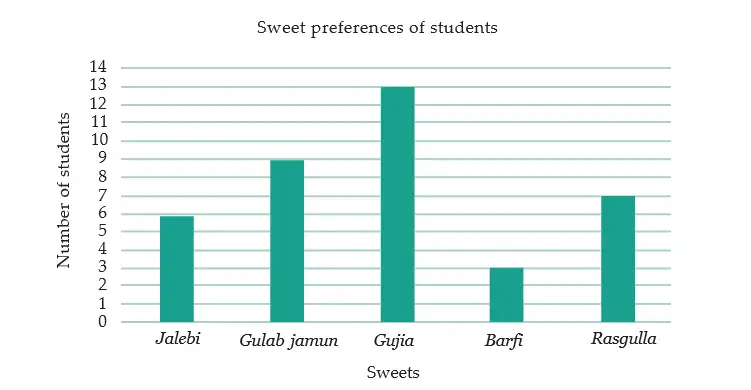
- Sweet preferences: Shri Nilesh collected each student’s choice from jalebi, Gulab jamun, gujiya, barfi, and rasgulla.
- Frequency table: Tally marks organise the choices and show how many students preferred each sweet.
Bar Graph and Scale
If one unit of bar length represents students, a category with frequency needs a bar of height units.
Use this to convert a frequency into bar length for the chosen scale.
How to Draw a Bar Graph
- Draw a horizontal axis for categories and a vertical axis for frequencies.
- Write the category names at equal intervals along the horizontal axis.
- Choose a scale that lets the largest frequency fit on the page.
- Draw one bar for each category, with height matching its frequency on the chosen scale.
Using a scale of 1 unit length = 1 student, what heights should the bars have for the sweet-preference data?
- Use a scale of one unit length for each student.
- Jalebi has a frequency of 6 students, so its bar is 6 units high.
- With the same scale, Gulab jamun has 9 units, Gujiya 13 units, Barfi 3 units and Rasgulla 7 units.
Choosing a Scale for Larger Frequencies
- Large frequencies: If one unit per item makes bars too tall, let each unit represent more items.
- Fit the graph: Choose a scale that allows the tallest bar to fit clearly on the available space.
A class has 8 students who choose apples and 12 who choose oranges. With a scale of 1 unit = 1 student, what are the bar heights?
A library records 20 storybooks and 30 picture books borrowed. If 1 unit represents 10 books, what are the bar heights?
Use the same scale for every bar; do not change the scale from one category to another.
Quick recap
- A bar graph represents category frequencies using bars.
- Place categories on the horizontal axis and frequencies on the vertical axis.
- Choose a scale before drawing the bars.
- With a scale of 1 unit = 1 student, each bar height equals its frequency in units.
- For large frequencies, use a scale that makes the graph fit clearly.
Drawing a Bar Graph Part-2
Choosing a Scale and Drawing Bar Graphs
- Bar graph: Place categories along one axis and their frequencies along the other, using bars of equal width and equal spacing.
- Scale: Choose a suitable scale so the bar heights represent the data accurately and fit clearly on the graph.
Representing and Reading Expenditure Data
| Item | Calculation | Bar height |
|---|---|---|
| House rent | 3,000 ÷ 200 | 15 units |
| Food | 3,400 ÷ 200 | 17 units |
| Education | 800 ÷ 200 | 4 units |
| Electricity | 400 ÷ 200 | 2 units |
| Transport | 600 ÷ 200 | 3 units |
| Miscellaneous | 1,200 ÷ 200 | 6 units |
Which are the two largest items of expenditure?
Is the electricity expenditure one-half of the education expenditure?
Is education expenditure less than one-fourth of food expenditure?
Quick recap
- Choose a scale that covers all values using convenient intervals.
- Place categories on the horizontal axis and values on the vertical axis.
- Keep bar widths and gaps uniform.
- Calculate bar height by dividing the value by the scale value per unit.
- Compare bar heights to interpret and answer questions about the data.
Drawing a Bar Graph Part-3
Drawing and Reading Bar Graphs
Divide the data value by the value represented by one unit length to find the bar length in units.
Draw a bar graph
- Label both axes and write the categories along the horizontal axis.
- Choose a suitable scale and mark equal intervals on the vertical axis.
- Draw equal-width bars up to the height for each value.
- Add a title and check that each bar matches its data value.
How can Samantha represent the numbers of five insect types in a bar graph?
- For the insect data, use one unit length to represent one insect.
- Label the horizontal axis with the five insect types and the vertical axis with insect counts.
- Draw bars with heights matching the counts: mites , caterpillars , beetles , butterflies , grasshoppers .
Frequency Distribution and Tally Marks
Adding the frequencies gives the total number of observations: .
Make a frequency table
- List each distinct category once in the first column.
- Record a tally each time that category occurs.
- Count the tallies and write the frequency in the next column.
- Check that the frequencies add up to the number of observations.
Which transport type was used most often in Chinu's observations, and what are the frequencies?
- Count how often each transport type appears in the recorded observations.
- Write each type and its frequency in a table.
- Check the total: observations.
Repeating an experiment
- Die-roll data: For rolls, record each result from to with tally marks and then count the frequencies.
- Minimum frequency: The result with the fewest occurrences.
- Maximum frequency: The result with the most occurrences.
- Equal frequencies: Results that have the same number of occurrences.
- Note: These answers depend on the actual rolls; there is no fixed frequency table before the results are recorded.
Using Frequencies to Find a Total
Multiply each value by its frequency, then add the products.
Find a total from frequencies
- Multiply each recorded value by the frequency beside it.
- Add all the products to obtain the total.
How many wickets did Bumrah take in total across the matches shown?
- Multiply each wickets count by its number of matches.
- Add the products to find the total wickets.
Do not add the distinct wickets values alone. Use each value multiplied by the number of matches in which it occurred, then add the products.
Reading a Pictograph
Multiply the number of symbols by the quantity represented by each symbol.
Interpret a pictograph
- Read the key to find the value of one symbol.
- Count the symbols for each category and calculate quantities if needed.
- Compare the quantities or find their difference as the question asks.
What comparisons can be read from the village tractor pictograph?
- The tractor pictograph uses one tractor symbol for one tractor.
- Compare the symbols: Village C has more tractors than Village B, and Village D has half as many as Village E.
Ticket counts are Vidisha , Jabalpur , Seoni , Indore , and Sagar . If one bar unit represents tickets, find each bar's length in units.
A set of observations is . Make a frequency summary and name the most frequent value.
A player scores points in games and points in games. What is the total number of points?
Quick recap
- A bar graph uses equal-width bars whose heights represent category values; label axes and state the scale.
- Convert a value to bar units by dividing it by the value represented by one unit length.
- A frequency table records how often each category or value occurs; tally marks can be grouped in fives.
- The sum of frequencies equals the number of observations.
- To find a total from a frequency table, multiply each value by its frequency and add the products.
- Read the pictograph key first, then compare, count, or calculate differences.
Drawing a Bar Graph Part-4
Reading and Making Pictographs
Use a pictograph key of 1 symbol for 6 dogs to represent the numbers of dogs in Villages A–F. Are there more dogs in Villages B and D together than in the other villages?
- Choose a key of 6 dogs per symbol, which divides all village counts evenly.
- Divide each village count by 6 to find the symbols needed.
- Compare the totals for Villages B and D with the other four villages.
Drawing a Bar Graph
Let be the data value, the value represented by one scale unit, and the bar height in units.
Constructing a bar graph
- Draw and label the axes; put categories on one axis and values on the other.
- Choose a suitable scale that includes all data values and starts at zero.
- Draw equal-width bars with equal gaps, each matching its category's value.
- Add a title and check each bar against the scale and data.
The sapling graph shows 30 planted on Wednesday, 40 on Thursday, and 310 for the week. Which day had the most and which had the fewest?
- Read Wednesday and Thursday's bar values from the graph.
- Use the graph's daily values to find the weekly total.
- Compare the bar heights: Saturday's value is greatest, and Wednesday's value is least.
Checking and Interpreting Graphs
- Quick comparison: Bar graphs make it easy to compare category values at a glance.
- Check bars: Match every bar to its category and data-table value; correct any bar that does not agree.
- Tiger data: Project Tiger began in 1973; exact tiger numbers began to be tracked in 2006. The graph's bars for 2006, 2010, 2014, and 2018 were incorrect and need correction using the frequency table.
- Explain variation: Rain or differences in student attendance may explain daily sapling totals; check such explanations against evidence.
In the girls' pictograph, which class has the fewest girls, and how many girls are in Class 7?
A bar graph uses a scale of 1 unit length = 5 students. What height represents 30 students?
Do not start the marked scale above zero or use unequal bar widths or gaps. Start from zero and keep bars equally wide and equally spaced.
Quick recap
- A pictograph's key gives the value represented by each symbol.
- Choose a pictograph key that represents the data simply.
- Bar graphs use equal-width, equally spaced bars to show category values.
- Choose a clear scale that fits all values and starts at zero.
- Read the scale to compare values, find totals, and identify the greatest or least.
- Check every bar against its category and the data table.
Artistic and Aesthetic Considerations Part-1
Making Data Presentations Clear and Appealing
Effective visual presentation — A visual presentation of data should fit its intended space and make the information easy to understand and visually appealing.
- Scale: Choose a suitable scale so the graph fits the available space.
- Clarity: Make the display easy to read and comparisons easy to see.
- Appearance: Choose a form that makes the information intuitive and appealing.
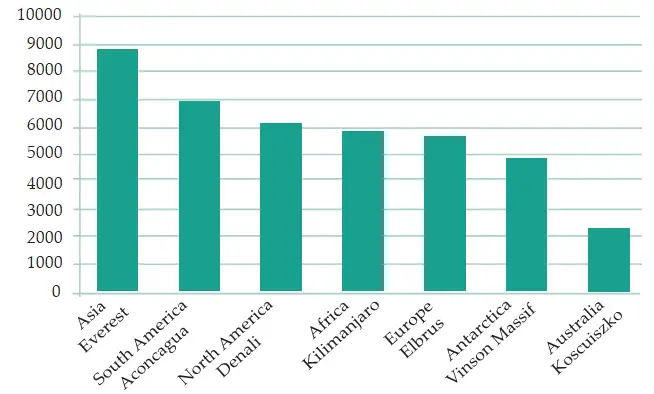
| Continent | Mountain | Height |
|---|---|---|
| Asia | Everest | |
| South America | Aconcagua | |
| North America | Denali | |
| Africa | Kilimanjaro | |
| Europe | Elbrus | |
| Antarctica | Vinson Massif | |
| Australia | Kosciuszko |
Comparing Mountain Heights
- Table limitation: Comparing many numbers in a table can make differences difficult to notice quickly.
- Bar graph: Bars of different lengths make relative values easier to compare at a glance.
- Column graph: Upright bars can suggest mountain heights rising from the ground.
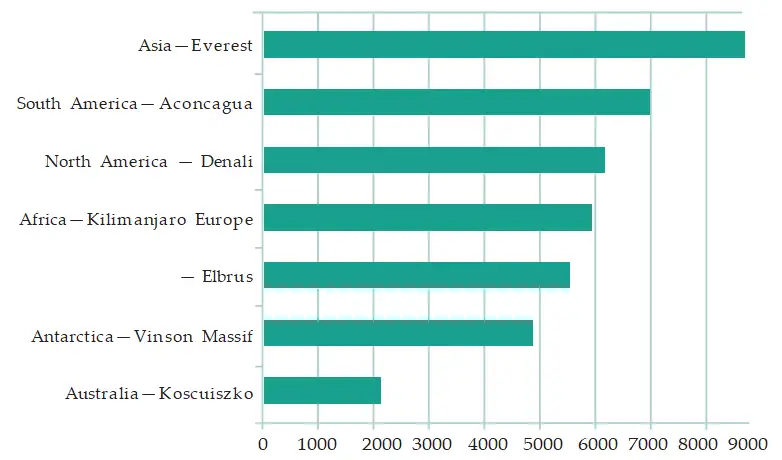
Column graph — A column graph is a bar graph with vertical bars.
Choosing a Graph Orientation
- Heights: Vertical columns can suggest objects growing upward from the ground, making height comparisons intuitive.
- Lengths and distances: Horizontal bars often suit measurements that extend parallel to the ground.
- Flexibility: Either orientation can display the same data; choose the one that is clearest for the audience and purpose.
Subtract the smaller measurement from the larger one to find how much greater it is.
How much taller is Everest than Kosciuszko?
- Use the heights of Everest and Kosciuszko.
- Subtract Kosciuszko’s height from Everest’s height.
- Include the unit in the result.
Choose a Suitable Bar Orientation
- Identify what the data measures, such as height, length, or distance.
- Choose vertical columns for upward heights or horizontal bars for ground-parallel lengths and distances.
- Check that the scale fits the space and that the bars make comparisons easy to see.
A school wants to compare the heights of the tallest students in each class. Which bar orientation is especially intuitive, and why?
For a graph comparing the lengths of the longest rivers on each continent, which orientation is often a natural choice, and why?
Quick recap
- Choose a suitable scale so a visual display fits its space.
- Graphs should be clear, easy to compare, and visually appropriate.
- A column graph is a bar graph with vertical bars.
- Vertical bars often suit heights; horizontal bars often suit lengths and distances.
- Bar graphs make comparisons easier to see than a long list of numbers.
- To find how much greater one measurement is, subtract the smaller value from the larger value.
Artistic and Aesthetic Considerations Part-2
Infographics
Designing an Accurate Data Visualisation
- Bar graphs: When comparing values, bars should have equal widths; their heights represent the data values.
- Shape and colour: Decorative shapes may make a graph more suggestive, but should not change how large or important a value appears.
- Misleading detail: If taller triangles are also wider, viewers may wrongly infer that the corresponding mountains are wider.
- Realistic imagery: A picture can look convincing yet show inaccurate proportions. Check the data rather than trusting appearance.
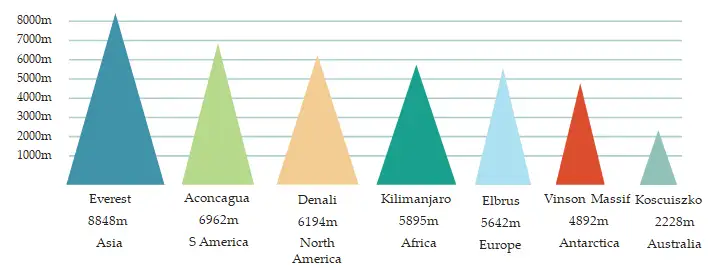
In a height-comparison graph, the visual height should represent the data value consistently, while unrelated dimensions such as width should not imply extra information.
For a consistent height comparison, represents the data value ; keep bar widths equal.
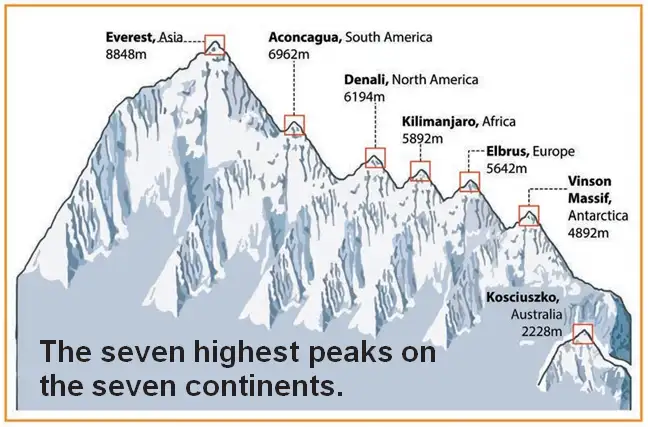
Check Whether an Infographic Is Accurate
- Identify which visual feature represents the data, such as height.
- Check whether other features, such as width or perspective, also change and imply extra information.
- Compare the picture with the actual values or a correctly scaled graph.
- Do not assume a realistic-looking picture is an accurate representation.
What is twice the height of a mountain that is m tall?
- The illustration makes Everest appear about twice as tall as Elbrus. If Elbrus is m, calculate twice its height.
- Multiply Elbrus's height by .
- The picture's appearance alone cannot confirm this comparison; check the actual mountain data.
A graph uses triangles that are both taller and wider for larger values. What could mislead a reader?
An infographic makes one mountain look twice as tall as another. What should you do before accepting that comparison?
Quick recap
- Infographics combine data visualisation and engaging imagery.
- Their purpose is to communicate information clearly and attractively.
- For height comparisons, bar widths should remain equal.
- Changing shapes or proportions can suggest information not contained in the data.
- Check actual values: realistic-looking pictures are not automatically accurate.
Summary
Data and Frequency
- Data: A collection of facts, numbers, measures, observations, or descriptions that conveys information.
- Organisation: Data can be arranged in a table using tally marks to make it easier to analyse and interpret.
- Frequency: The number of times a value, measure, or observation occurs.
Pictographs and Bar Graphs
Use the scale to convert symbols or bar lengths into counts.
For a bar graph, divide a bar’s measured height or length by the graph units used per frequency unit.
Choosing and Reading Graphs
Read a Pictograph or Bar Graph
- Read the title and identify what the categories represent.
- Check the scale and labels to find the frequency represented by each symbol or graph unit.
- Convert symbols or bar lengths into frequencies, then compare the values.
- Use the comparison to make a conclusion supported by the data.
How many books does each category represent, and how many more books are in Category B?
- A pictograph uses one symbol for 4 books. Category A has 3 symbols and Category B has 5 symbols. Find each frequency and the difference.
- Convert Category A’s symbols using the scale.
- Convert Category B’s symbols using the scale.
- Subtract the smaller frequency from the larger one.
In a pictograph, each picture represents 3 students. A team has 4 pictures. How many students does it represent?
On a bar graph, each 1 cm of bar length represents 5 items. A bar is 4 cm long. What frequency does it show?
Do not assume each picture or graph unit represents one item; always check the stated scale before finding or comparing frequencies.
Quick recap
- Data conveys information through facts, numbers, measures, observations, or descriptions.
- Tally marks organise data, and frequency counts how often a value occurs.
- Pictographs use symbols whose frequency value is set by a stated scale.
- Bar graphs use uniform-width bars, with height or length showing frequency according to a scale.
- Choose clear scales and designs so graphs represent data accurately and do not mislead.
- Read graph scales carefully to compare data and make supported inferences.