Class 9 . Social Science . Understanding Society India and Beyond Part I . The Price Puzzle What Drives the Market
Chapter 9: The Price Puzzle: What Drives the Market
Ch 9
Social Science
Class 9
Demand
Meaning of Demand
- Demand: The quantity of a product consumers are willing and able to buy at a particular price.
- Purchasing power: Demand requires both the desire to buy and the ability to pay; needs, preferences, season, trends and income also influence it.
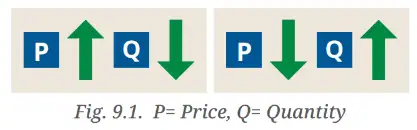
The Law of Demand
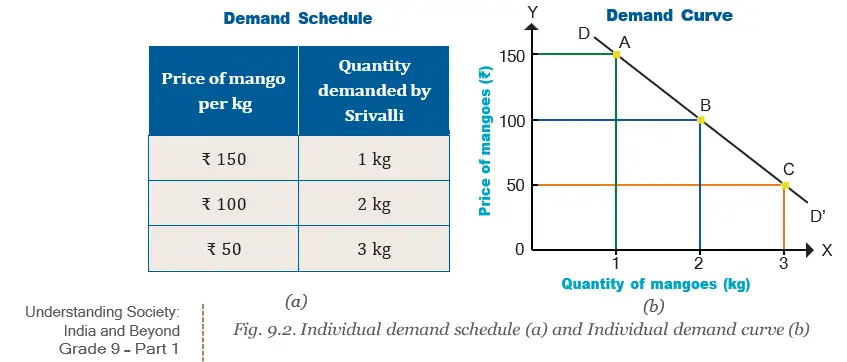
Individual Demand and the Demand Curve
Market Demand
Add all consumers' quantities demanded at the same price.
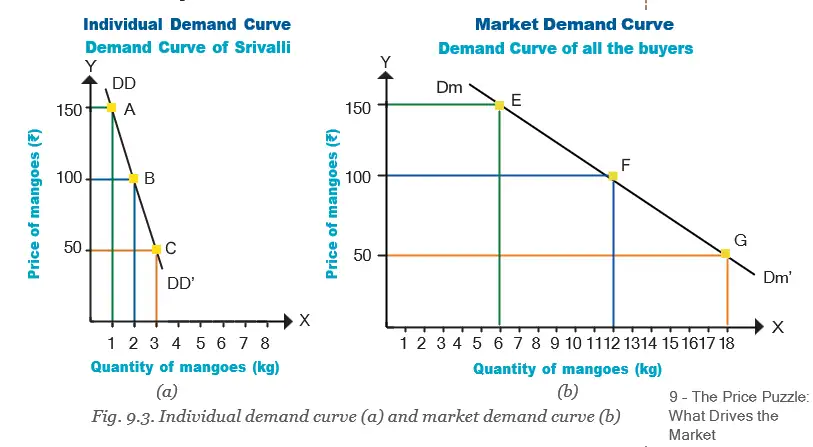
Why the Market Demand Curve Is Flatter
State the law of demand.
How is market demand calculated?
Quick recap
- Demand requires both willingness to buy and purchasing power.
- The law of demand describes an inverse relationship between price and quantity demanded, with other factors constant.
- An individual demand schedule shows one buyer's quantities at different prices; its graph is a downward-sloping demand curve.
- Market demand is the sum of all individual demands at each price.
- Market demand may respond more in total to a price change, making its curve flatter.
Other Determinants of Demand
Demand Can Change for Reasons Other Than Price
- Demand determinants affect how much consumers want to buy, even when the good’s own price remains unchanged.
- Example: A popular new smartphone model may attract queues and pre-bookings despite its higher price.
Price of Related Goods
Related goods — Products whose demands are connected, so a change in the price or availability of one affects demand for the other.
| Point | Substitute goods | Complementary goods |
|---|---|---|
| Use | Can replace one another. | Are generally used together. |
| Effect of a price rise | If one becomes more expensive, demand for its relatively cheaper substitute tends to rise. | If one becomes more expensive, demand for the good used with it may fall. |
| Examples | Tea and coffee; mangoes and bananas. | Smartphones and earphones; cars and petrol; printers and cartridges. |
How Related Goods Affect Demand
- Substitutes: If coffee becomes more expensive while tea’s price is unchanged, some consumers may switch to tea, raising tea demand.
- Consumer choice: If mangoes are unaffordable, a buyer may choose bananas; personal preferences can affect whether switching occurs.
- Complements: If cinema tickets become more expensive, fewer people may go, reducing demand for cinema-hall popcorn even if its price is unchanged.
Income of the Consumer
- Higher income generally allows consumers to buy more or choose higher-quality products.
- Demand effect: A rise in household income can increase the quantity demanded of several goods, even when their prices do not change.
Taste and Preference of the Buyer
- Preferences influence which products consumers want and whether they are willing to switch to alternatives.
- Example: Someone who particularly likes mangoes may keep choosing them even when oranges are cheaper.
Population Size and Composition
- Population size: A large population can generate substantial domestic consumer demand; India’s population contributes to its economic growth.
- Population composition: The age and working profile of people influence which goods and services are in demand.
- Examples: More children may raise demand for sports shoes, more working adults for formal shoes, and more elderly people for comfortable or orthopaedic shoes.
Diminishing Marginal Utility
Diminishing marginal utility — The additional usefulness or satisfaction from each successive unit of a product declines as more is consumed.
Effect on Demand
- More units consumed → additional utility declines
- Additional utility declines → willingness to pay falls
- Willingness to pay falls → demand for further units falls
Seasonality
- Seasonality means demand for some products changes at different times of the year, often due to weather, festivals, or cultural habits.
- Examples: Bookshops may be crowded at the start of the academic session; sweets are in demand during festivals; sweaters and jackets are sought in winter.
Future Price Expectations
| Expectation | Effect on current buying | Effect on present demand |
|---|---|---|
| Prices will fall | Consumers may postpone purchases. | Decreases. |
| Prices will rise | Consumers may buy sooner. | Increases. |
- Example: People expecting festival discounts may delay buying durable goods before Diwali or the New Year, reducing present demand.
- Substitute goods
- Goods that can replace one another.
- Complementary goods
- Goods generally used together.
- Marginal utility
- The additional usefulness or satisfaction from consuming one more unit.
- Seasonality
- Demand changes linked to time of year, weather, festivals, or cultural habits.
How do substitute and complementary goods affect demand when the price of one related good rises?
Explain how future price expectations affect present demand.
Quick recap
- Demand can change even when the good’s own price remains unchanged.
- A rise in the price of a substitute tends to raise demand for the other; a rise in the price of a complement may lower demand for its partner.
- Higher household income generally increases demand for several goods.
- Consumer tastes, population size, and population composition shape demand.
- As more units are consumed, marginal utility and willingness to pay tend to decline.
- Weather, festivals, and cultural habits create seasonal changes in demand.
- Expected price falls can delay purchases; expected rises can bring purchases forward.
Supply
Meaning and Law of Supply
Supply — The quantity of a product that sellers are willing and able to offer at a particular price.
Law of supply
- Relationship: As price rises, quantity supplied generally rises; as price falls, quantity supplied generally falls.
- Reason: Higher prices can make production more profitable, encouraging existing producers to increase output and new firms to enter.
- Individual supply: The quantity one particular seller offers at different prices.
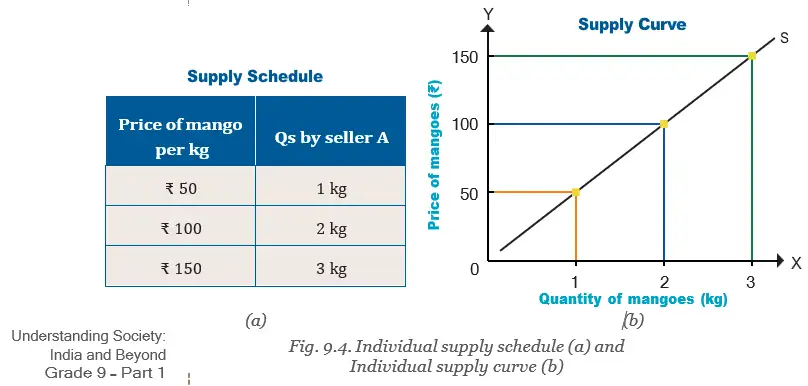
Supply, Demand and Market Supply
How supply and demand affect prices
- At the start of mango season, supply is low → mangoes are costly.
- As the season progresses, supply increases → prices tend to fall.
- Supply less than demand → prices rise; supply greater than demand → prices fall.
Market supply — The total quantity supplied by all sellers in a market at a given price.
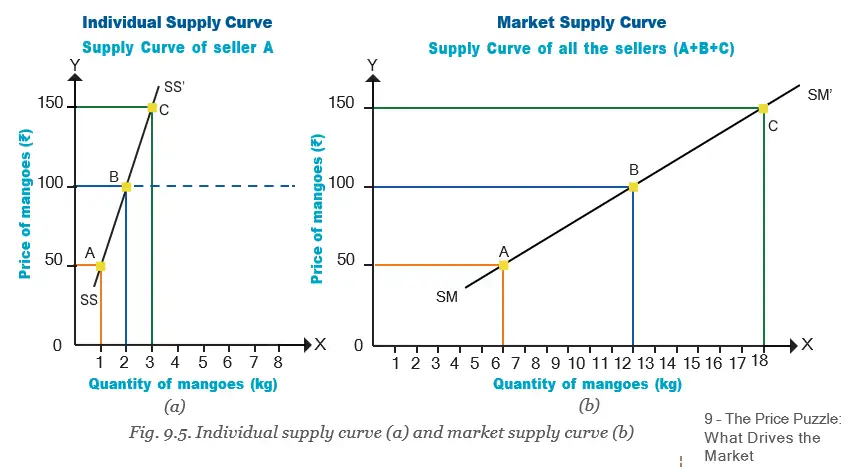
Add the quantities supplied by each seller at the same price.
| Price | Seller A (kg) | Seller B (kg) | Seller C (kg) | Market supply (kg) |
|---|---|---|---|---|
| ₹50 | 1 | 3 | 2 | 6 |
| ₹100 | 2 | 4 | 6 | 12 |
| ₹150 | 3 | 7 | 8 | 18 |
- Market supply curve: Plot market quantity supplied against its corresponding price; it slopes upward when higher prices lead to greater quantity supplied.
- Example: At ₹100, market supply is kg.
Other Determinants of Supply
| Determinant | Effect on supply | Example |
|---|---|---|
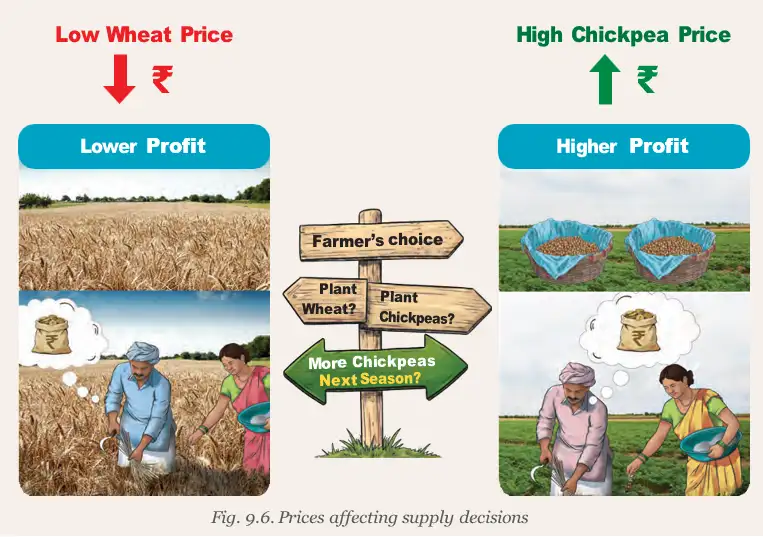
| Price of related goods | A supplier may produce more of the alternative that is more profitable. | If wheat prices are low and chickpea prices are high, a farmer may grow more chickpeas. |
| Number of sellers | More sellers can increase market supply; fewer sellers can reduce it. | More supply than demand can push prices down; less supply than demand can push prices up. |
| Technology | Improved technology can lower production costs and raise output and supply; the reverse can reduce supply. | Drip irrigation and weather sensors can raise crop production; cold storage can increase mango supply reaching distant markets. |
| Future expectations | Expected stronger future demand can encourage more production; expected weaker demand can lead producers to cut production. | Potato wholesalers expecting peak-season price rises may hold back supply to sell later. |
- Supply
- Quantity sellers are willing and able to offer at a particular price.
- Law of supply
- The general relationship in which higher prices lead to higher quantity supplied, and lower prices to lower quantity supplied.
- Individual supply
- Quantity offered by one seller at different prices.
- Market supply
- Sum of the quantities offered by all sellers at a given price.
State the law of supply and explain why the supply curve generally slopes upward.
How is market supply calculated?
Quick recap
- Supply is the quantity sellers are willing and able to offer at a particular price.
- By the law of supply, higher prices generally lead to higher quantity supplied.
- Market supply is the sum of individual sellers’ quantities at the same price.
- Low supply relative to demand tends to raise prices; abundant supply relative to demand tends to lower them.
- Related goods, the number of sellers, technology and future expectations can affect supply.
Market Equilibrium
Market Equilibrium
Finding Equilibrium on a Graph
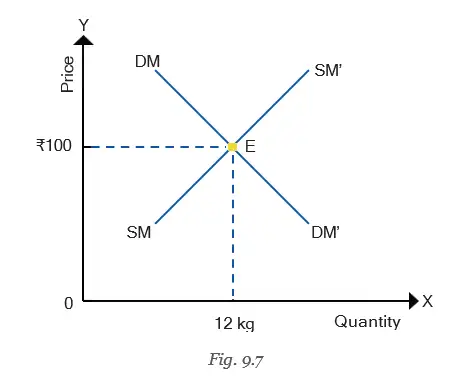
- Intersection: Equilibrium is where the demand curve and supply curve cross.
- Point E: The intersection represents the equilibrium price and equilibrium quantity.
- For the mango market: Point E corresponds to ₹100 and 12 kg.
Equilibrium in Real-World Markets
Mask Market Example
- 2020During the COVID-19 pandemic, mask demand rose sharply; limited immediate supply contributed to higher prices.
How the Mask Market Adjusted
- Pandemic increases demand for masks
- Supply cannot immediately keep up
- Mask prices rise
- Suppliers adjust and increase supply
- Demand later falls, so prices decline towards pre-pandemic levels
Hotel Tariffs: A Dynamic Market Example
- Changing tariffs: A Goa hotel charges ₹1,500 on an off-season weekday, ₹8,000 on a December weekend and ₹25,000 on New Year’s Eve.
- What affects prices: Booking rates, nearby hotels’ tariffs, local events, weather forecasts, time until arrival and past booking trends can all affect room prices.
Markets and Long-Term Sustainability
- Market equilibrium
- The point where quantity supplied equals quantity demanded.
- Excess demand
- A shortage that occurs when quantity demanded is greater than quantity supplied.
- Excess supply
- A surplus that occurs when quantity supplied is greater than quantity demanded.
- Dynamic market
- A market where changing conditions continually affect demand, supply and prices.
What happens to price when a market has excess demand or excess supply?
Why is real-world market equilibrium not permanently stable?
Quick recap
- Market equilibrium occurs when quantity supplied equals quantity demanded.
- A price below equilibrium can create excess demand; a price above it can create excess supply.
- For mangoes, equilibrium is ₹100 and 12 kg.
- Changing conditions continually move real-world markets towards new equilibrium points.
- Hotel tariffs respond to season, booking patterns, competition and local events.
- Unsustainable resource use can reduce future supply and shift market equilibrium.
Role of Government in the Economy
Why Government Has a Role in the Economy
Markets and fairness
- India’s economy is market-based and regulated; prices are influenced by demand and supply. The lecture describes India as the world’s fourth-largest economy.
- Market limitation Markets allocate goods according to people’s willingness and ability to pay, so essentials may become unaffordable for low-income groups.
- Government role Intervention can promote fairness and equity, protect vulnerable people, and support social welfare when markets fail.
Regulating Unfair Practices
Price controls and market power
- Price ceiling A government-set maximum price sellers may charge; it can help keep essentials such as medicines affordable.
- Price floor A government-set minimum price. To be effective, it must be above the market equilibrium price; minimum wages protect workers’ earnings.
- Monopoly A single seller controls the supply of a unique product or service with no close substitutes, giving it substantial power over price and output.
- Monopoly risk A dominant seller may charge higher prices, supply less, or provide poorer-quality goods and services, harming consumers.
- Regulation Governments may monitor prices and quantities supplied to limit exploitation and protect consumers, workers and producers.
| Point | Price ceiling | Price floor |
|---|---|---|
| Meaning | Maximum permitted price | Minimum permitted price |
| Purpose / example | Keep essentials affordable, such as medicines | Protect workers through a minimum wage |
| Effective placement | Restricts prices when set below the market price | Must be above market equilibrium to be effective |
Market regulators and emergency price control
- Regulatory bodies The Reserve Bank of India (RBI) regulates banking; the Central Consumer Protection Authority addresses consumer-rights violations and unfair trade practices; TRAI regulates telecommunications; SEBI regulates the securities market.
- COVID-19 example A surge in demand for sanitisers led to shortages and sharp price rises; some sellers hoarded stock and engaged in black marketing.
- Government response Under the Essential Commodities Act, 1955, sanitisers were declared essential commodities and the maximum retail price was capped at Rs. 100 for a 200 ml bottle.
- Market response The cap limited what consumers could be charged; companies also began producing sanitisers, which later became more widely available at fair prices.
- Trade-off Emergency controls may protect consumers, but a lasting price cap can weaken suppliers’ incentives if they cannot cover costs or earn adequate returns.
- Price ceiling
- A government-imposed maximum price a seller can charge.
- Price floor
- A government-imposed minimum price; to be effective, it is set above market equilibrium.
- Monopoly
- A market structure with one seller controlling a unique product or service with no close substitutes.
- Hoarding
- Accumulating goods beyond immediate need, often due to expected shortages or price rises.
- Black marketing
- Illegal trade in goods or services that are banned or regulated.
- Public goods
- Goods and services provided or funded for public benefit, such as roads, parks and streetlights.
Emergency price-control example
- 1955The Essential Commodities Act was enacted; during COVID-19, sanitisers were declared essential commodities and their maximum retail price was capped.
Provision of Public Goods
Public goods — Goods and services provided or funded by government for the benefit and use of the public.
Why government provides or funds them
- Examples Roads, bridges, public parks, streetlighting, national defence, sanitation and drainage.
- Private-sector gap These services may not generate direct profit for private companies, even when many people benefit from them.
- Free-rider problem People may expect others to pay for a shared service while still using it themselves. If too few contribute, a needed service—such as a neighbourhood park—may not be built.
- Public purpose Government provision or funding supports social welfare, economic development and more equal access to essential services.
Why a shared good may be underprovided
- Many households benefit from a service → each may hope others will pay → contributions are insufficient → the service may not be provided → government funding or provision can fill the gap.
Limitations of Government Intervention
| Limitation | How it can affect the economy | Example |
|---|---|---|
| Price distortions and reduced producer incentives | A price fixed below market levels can reduce returns, production and supply, causing shortages. | If wheat is capped at Rs. 20 per kg while the market price is Rs. 30, farmers may produce less. |
| Compliance burdens | Licences, permits and complex procedures add time and costs, especially for small businesses. | A small restaurant may need food-safety, fire-safety, pollution-control and local clearances. |
| Discouraged innovation and entrepreneurship | Heavy regulation or price controls can reduce incentives to invest in new ideas, technology and improved production. | Farmers may avoid better seeds, irrigation or technology if returns are inadequate; productivity and long-term output may fall. |
How a low price cap can lead to shortages
- Government fixes a maximum price below the market level → producers receive less than they otherwise would → incentive or ability to supply falls → production may decline → shortages can result.
Explain both sides of intervention: it can protect people and address market failures, but excessive controls may reduce supply, raise compliance costs and discourage investment.
Markets, Government and Changing Conditions
| Concept | Meaning and key relationship | Main influences |
|---|---|---|
| Demand | Quantity consumers are willing and able to buy at different prices; as price falls, quantity demanded rises. | Income, prices of substitutes and complements, tastes, seasonality, future expectations and population. |
| Supply | Quantity sellers are willing and able to offer at different prices; as price rises, quantity supplied increases. | Prices, prices of related goods, number of sellers, technology, input costs and factors such as weather. |
| Market equilibrium | The point at which quantity demanded equals quantity supplied; changing conditions can move the market toward a new equilibrium. | Weather, trends, technology, income and other changes to demand or supply. |
Making intervention decisions
- Democratic accountability Government is expected to act in people’s interests when deciding whether and how much to intervene.
- Voices to consider Decisions should take account of consumers, producers, workers and other affected groups, weighing welfare against effects on supply and livelihoods.
- Dynamic markets Markets keep adapting to shifts in demand, supply and conditions; intervention may help or harm depending on the problem and the policy used.
Why does the government provide or fund public goods?
State two possible adverse effects of excessive government intervention.
What is the difference between a price ceiling and a price floor?
Quick recap
- Markets allocate goods by willingness and ability to pay, so government may intervene to protect fairness and vulnerable groups.
- Price ceilings set maximum prices; price floors set minimum prices and must be above equilibrium to be effective.
- Monopolies can restrict supply, raise prices or reduce quality; regulators oversee markets and unfair practices.
- Government provides or funds public goods that may be underprovided because private firms lack direct profit incentives and people may free-ride.
- Excessive intervention can reduce production incentives, create compliance burdens and discourage innovation.
- Demand and supply respond to changing conditions, so markets move toward new equilibria; policies should weigh public welfare against their costs.
Social Science — ALL CHAPTERS
1
The French Revolution
2
Socialism In Europe And The Russian Revolution
3
Nazism And The Rise Of Hitler
4
Forest Society And Colonialism
5
Pastoralists In The Modern World
1
Understanding Social Science
2
Shaping of the Earth’s Surface
3
Atmosphere and Climate
4
Early Humans and Beginning of Civilisation
5
State and Society up to 1000 CE
6
Democracy
7
Elections
8
Building Blocks in Economics: The Problem of Choice
9
The Price Puzzle: What Drives the Market