NEET UG . NEET Zoology . Zoology . Ecosystem
Chapter 12: Ecosystem
Ch 12
NEET Zoology
NEET UG
Ecosystem-Structure and Function
Ecosystem: Meaning and Types
- Ecosystem: A self-regulating, self-sustaining unit in which living communities interact with and exchange materials with their physical environment; A.G. Tansley coined the term in 1935.
- Types: Natural ecosystems are terrestrial, such as forests and deserts, or aquatic, such as ponds and rivers; crop fields and aquariums are man-made ecosystems.
Ecosystem Structure and Function
- Open system: An ecosystem receives solar energy, which flows unidirectionally through it.
- Material cycling: Matter cycles between the living and non-living components of an ecosystem.
Biotic Components
- Living components: Biotic components include all organisms in an ecosystem.
- Functional groups: Producers make organic food, consumers obtain it by feeding on other organisms, and decomposers break down dead matter and wastes.
Abiotic Components
- Abiotic components: These are the non-living substances and environmental factors of an ecosystem.
- Examples: Light, temperature, wind, soil and water influence organisms and ecosystem processes.
Patterns of Ecosystem Structure
- Physical structure: Interactions between biotic and abiotic components give each ecosystem its characteristic structure.
- Species composition: The kinds and numbers of plant and animal species vary with geography, topography and climate; diversity is greatest in tropical rain forests and coral reefs and lowest in deserts and arctic regions.
- Stratification: Species occupy distinct vertical levels; tropical rain forests may have 5–7 strata, including emergent trees, canopy, understory, shrubs, herbs and grasses.
Quick recap
- Ecosystems are self-regulating, self-sustaining units where biotic communities interact with the abiotic environment.
- A. G. Tansley coined “ecosystem” in 1935; ecosystems may be natural or man-made, and terrestrial or aquatic.
- Ecosystems are open systems: solar energy flows from producers to consumers, while matter cycles between living and non-living components.
- Producers make organic food, consumers obtain it from other organisms, and decomposers externally digest and break down dead matter.
- Light, wind, soil, temperature and water influence ecosystem conditions and organisms.
- Species composition describes which species occur; stratification describes their vertical distribution.
- Productivity, decomposition, energy flow and nutrient cycling are the four key functional aspects.
Productivity
Productivity — The rate at which producers generate biomass or organic matter per unit area over a given time.
Primary Productivity
Primary productivity — The amount of biomass or organic matter produced by plants through photosynthesis per unit area over a given time.
| Point | Gross primary productivity (GPP) | Net primary productivity (NPP) |
|---|---|---|
| Meaning | Rate of organic matter production by green plants during photosynthesis per unit area and time. | Organic matter remaining in producers after respiration per unit area and time. |
| Relationship | Total production through photosynthesis. | Biomass available to heterotrophs, including herbivores and decomposers. |
Plants use part of GPP in respiration; the remainder is stored as organic matter.
Factors Affecting Primary Productivity
- Plant species: Productivity depends on the plant species present in an area.
- Environment: Environmental conditions, nutrient availability and plants’ photosynthetic capacity affect productivity.
- Variation: These factors cause primary productivity to differ among ecosystems.
Annual Net Primary Productivity
- Biosphere: Approximately 170 billion tons of organic matter (dry weight) are produced annually.
- Oceans: Despite covering about 70% of Earth’s surface, oceans contribute about 55 billion tons annually.
- Land: The remaining 115 billion tons of annual productivity comes from land.
Secondary Productivity
Secondary productivity — The rate at which consumers assimilate food energy, making energy available at the consumer level for transfer to the next trophic level.
Differentiate between GPP and NPP.
What is secondary productivity?
Quick recap
- Productivity is biomass or organic matter produced per unit area over time.
- A constant solar-energy input is essential for ecosystem functioning.
- GPP is total plant production; NPP is GPP remaining after respiration.
- NPP = GPP - R and represents biomass available to heterotrophs.
- Primary productivity varies with plant species, environmental factors, nutrients and photosynthetic capacity.
- Annual biosphere NPP is about 170 billion tons: 55 billion from oceans and 115 billion from land.
- Secondary productivity is consumers’ assimilation of food energy for transfer to the next trophic level.
Decomposition
Decomposition and Detritus
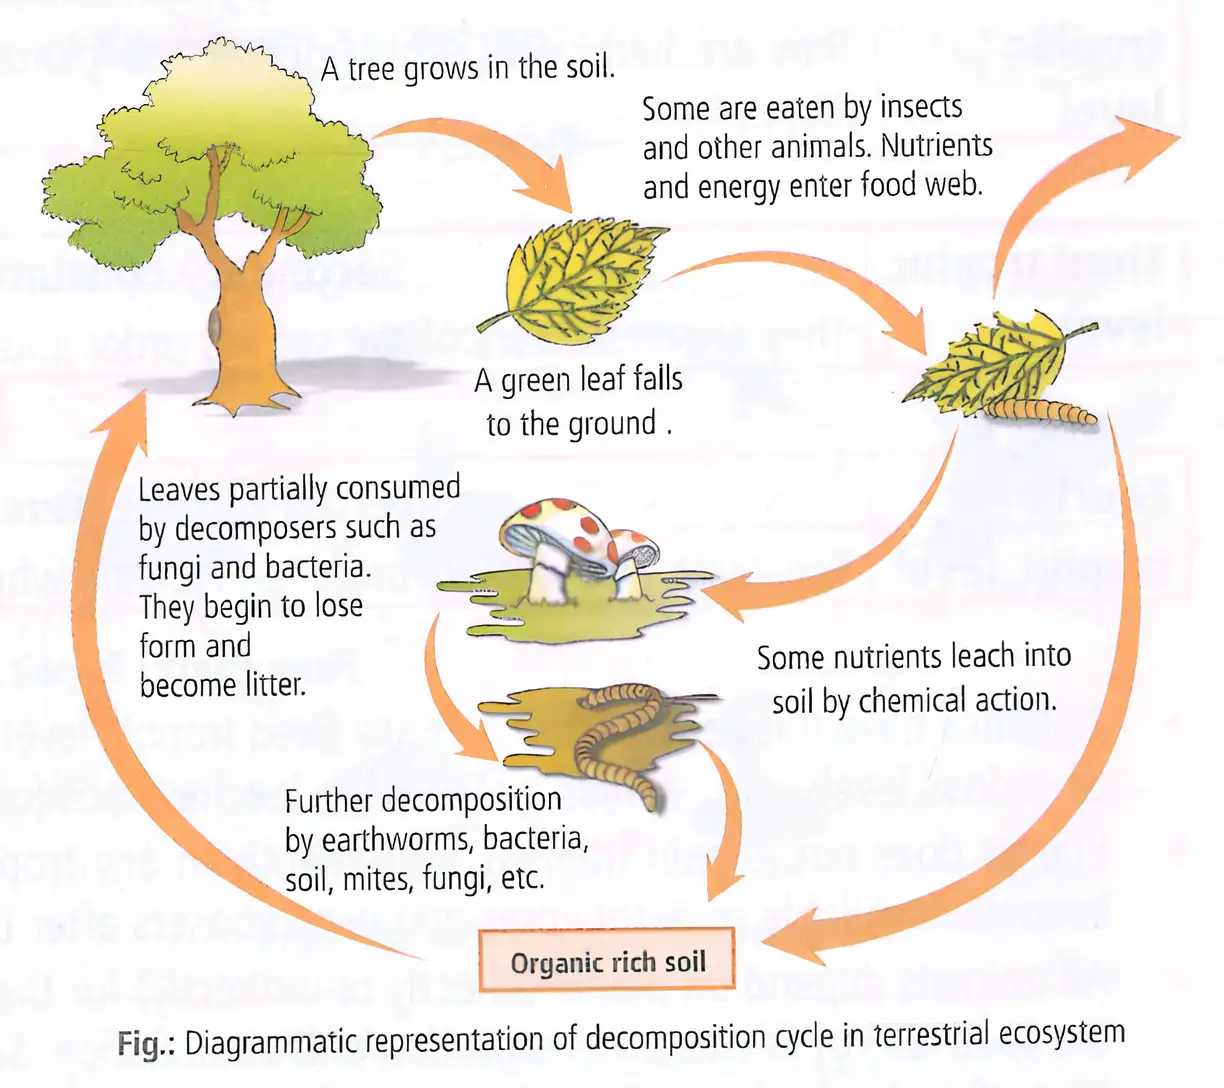
Decomposition — The physical and chemical breakdown of detritus into inorganic substances such as carbon dioxide, water and nutrients.
- Detritus is the raw material for decomposition: dead plant and animal remains, including faecal matter.
- Examples include leaves, bark, flowers, dead roots, animal remains, droppings and excretions.
- Importance Decomposition disposes of detritus, recycles biogeochemicals and creates space for newer generations of organisms.
- Earthworms are called farmers’ friends because they break down organic matter and loosen the soil.
| Type | Examples |
|---|---|
| Above-ground | Leaf litter, dried plant parts, animal remains, droppings and excretions |
| Below-ground | Mainly dead roots; also underground dead animals |
Factors Affecting Decomposition
- Controls Detritus composition and climatic conditions affect the rate of decomposition.
- Slow decomposition occurs when detritus is rich in lignin and chitin.
- Fast decomposition occurs when detritus is rich in nitrogen and water-soluble substances such as sugars.
- Climate factors affecting decomposition include temperature, moisture and pH.
| Condition | Effect |
|---|---|
| Lignin- and chitin-rich detritus | Slower decomposition |
| Nitrogen- and sugar-rich detritus | Faster decomposition |
Processes Involved in Decomposition
- Fragmentation Detritivores such as termites and earthworms break detritus into smaller particles. Digestion pulverises it and greatly increases its surface area.
- Catabolism Bacteria and fungi secrete enzymes that convert complex, insoluble organic matter into simple, soluble organic compounds and inorganic substances. Decomposers absorb and immobilise some breakdown products.
- Leaching Percolating water carries soluble substances, including sugars and nutrients, into deeper soil layers or groundwater.
- Humification is the accumulation and formation of dark, amorphous humus, rich in lignin and cellulose. Humus is colloidal, resists microbial action and decomposes extremely slowly.
- Humus acts as a nutrient reservoir and helps maintain soil moisture and aeration.
- Mineralisation Microbes further degrade humus and release inorganic nutrients. It is slow because humus may be trapped and nutrients immobilised in decomposers.
Oxygen and Decomposition
- Aerobiosis Decomposition requires oxygen for decomposer activity.
- Anaerobiosis Oxygen-poor conditions reduce decomposition and cause detritus to accumulate.
What factors determine the rate of decomposition?
What is humification, and what are the functions of humus?
Quick recap
- Decomposition breaks down detritus into inorganic substances, recycling biogeochemicals and clearing detritus.
- Detritus is above-ground or below-ground; dead roots are the main below-ground source.
- Lignin- and chitin-rich detritus decomposes slowly; nitrogen- and sugar-rich detritus decomposes faster.
- The main processes are fragmentation, catabolism, leaching, humification and mineralisation.
- Humification forms humus, a resistant nutrient reservoir that supports soil moisture and aeration.
- Decomposition requires oxygen; anaerobic conditions slow it and allow detritus to accumulate.
Energy Flow
Energy Flow in Ecosystems
- Energy source: The Sun supplies energy to almost all ecosystems; deep-sea hydrothermal ecosystems are an exception.
- Energy capture: Less than 50% of incident solar radiation is photosynthetically active radiation (PAR), and autotrophs capture only 2–10% of PAR.
- Energy flow: Energy moves from producers to consumers in one direction, consistent with the laws of thermodynamics.
Food Chains and Trophic Levels
Standing crop — The living biomass or number of organisms present per unit area in an ecosystem or trophic level.
Parasites and Trophic Levels
- Parasites: They have no single fixed trophic level because they can feed on producers, herbivores or carnivores at different levels.
- Examples: Aphids, ticks, mites, leeches and mosquitoes.
Energy Loss and Transfer
- Feeding losses: Food energy is lost through digestion and assimilation; only a small part of assimilated food becomes herbivore body mass.
- Further transfer: Herbivores are eaten by primary carnivores, which may be eaten by secondary carnivores; much energy is lost as heat at each step.
- Decomposers: Dead organisms and waste make energy available to detritivores and decomposers.
Ten Percent Law
Use the 10% law to estimate energy passed to the next trophic level.
Types of Food Chain
- Grazing food chain: Begins with producers and passes to consumers, as in grass → goat → human.
- Parasitic food chain: Begins with a host and usually ends with its parasites.
- Detritus food chain: Begins with dead organic matter and passes through detritivores and decomposers to consumers.
Food Web
State Lindeman’s 10% law and one consequence.
Differentiate a grazing food chain from a detritus food chain.
What is a food web, and why is it important?
Quick recap
- Energy flow is unidirectional, beginning with the Sun except in deep-sea hydrothermal ecosystems; all organisms depend on producers directly or indirectly.
- Autotrophs capture only 2–10% of PAR, and energy and biomass generally decline at higher trophic levels.
- Standing crop is living biomass or organism number per unit area; dry weight is preferred.
- 10% law: Only about one-tenth of energy passes to the next level, so shorter food chains are more efficient.
- Food chains may be grazing, parasitic or detritus-based; grazing chains include producers, consumers and decomposers.
- Food webs connect chains through alternative feeding links and support ecosystem stability.
Ecological Pyramids
Ecological Pyramids
Ecological pyramid — A graphical representation of organisms at different trophic levels in terms of their numbers, biomass or energy.
- Structure: Producers form the base; tertiary or top-level consumers form the apex.
- Origin: Charles Elton developed ecological pyramids in 1927; they are also called Eltonian pyramids.
- Calculation: Include all organisms at a trophic level when calculating numbers, biomass or energy.
- Trophic level: A functional position in a food chain, not a species; one species may occupy more than one level.
A species can occupy multiple trophic levels
- Example: A sparrow is a primary consumer when eating seeds, fruits or peas, but a secondary consumer when eating insects or worms.
Types of Ecological Pyramids
| Pyramid | What it represents | Typical shape | Example |
|---|---|---|---|
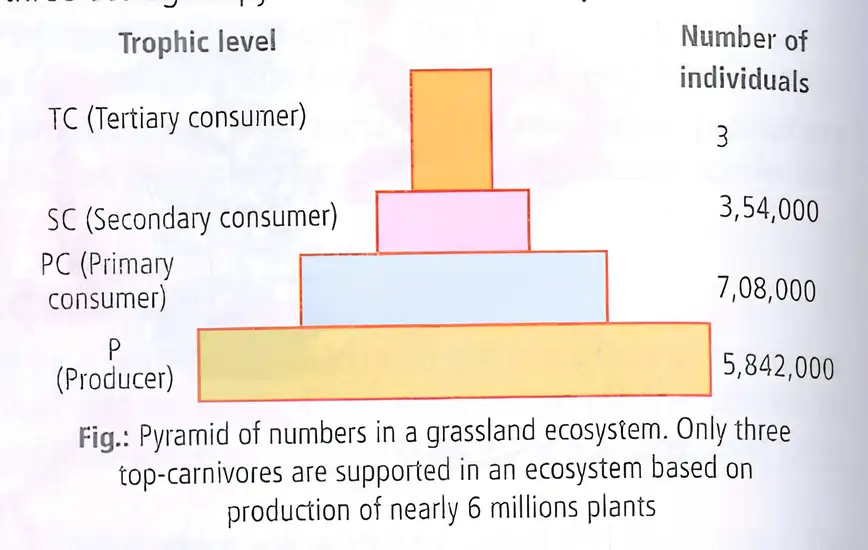
| Numbers | Number of individuals per unit area at each trophic level | Upright, inverted or spindle-shaped | Grassland and pond: upright; parasitic tree chain: inverted; forest: spindle-shaped |
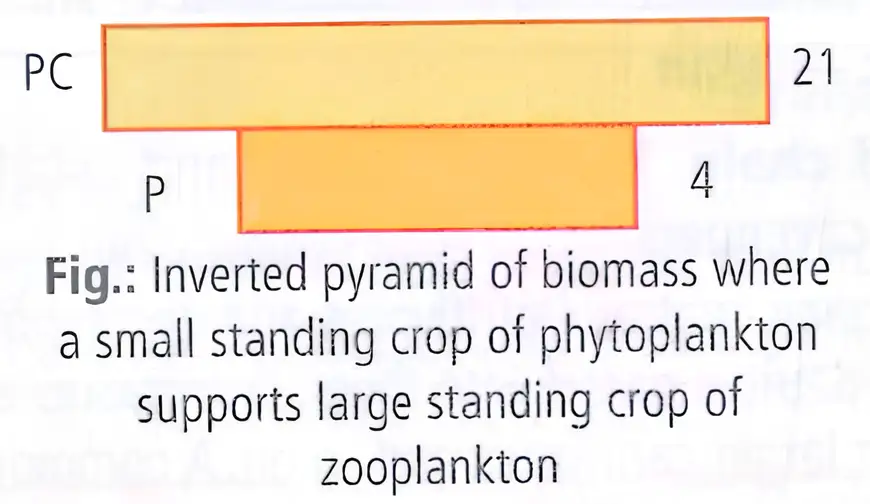
| Biomass | Total biomass per unit area at successive trophic levels | Usually upright on land; inverted in aquatic ecosystems | A small phytoplankton crop can support a larger zooplankton crop |
| Energy | Rate of energy flow or productivity per unit time and area at successive trophic levels | Always upright | Energy decreases from producers to higher consumers |
Pyramid of Numbers
- Upright: Numbers generally decrease towards higher trophic levels; common in grassland and pond ecosystems.
- Inverted: In a parasitic tree food chain, one plant supports many herbivores, which support many parasites and hyperparasites; numbers increase towards consumers.
- Spindle-shaped: Found in forest ecosystems.
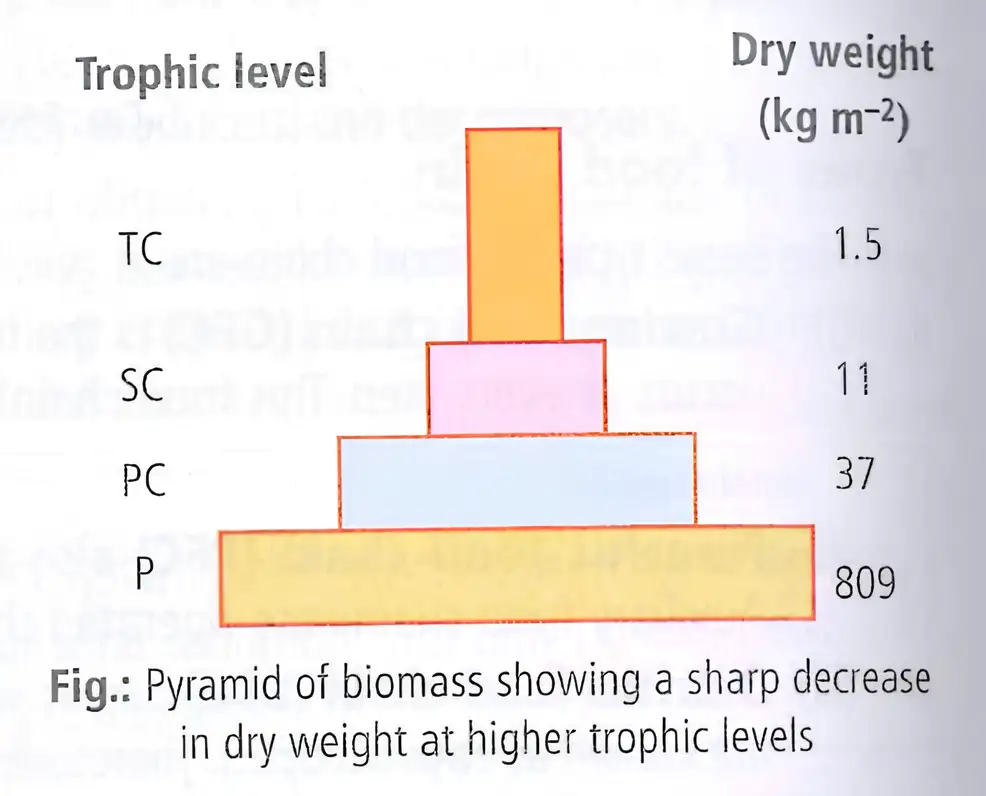
Pyramid of biomass — Shows the total biomass per unit area at successive trophic levels.
- Terrestrial habitats: Biomass pyramids are usually upright, with biomass decreasing at higher trophic levels.
- Aquatic ecosystems: Biomass pyramids are inverted because the small producer biomass can support a larger consumer biomass.
Pyramid of energy — Shows the rate of energy flow or productivity per unit time and area at successive trophic levels.
- Shape: Always upright because energy content decreases at each successive trophic level from producers to consumers.
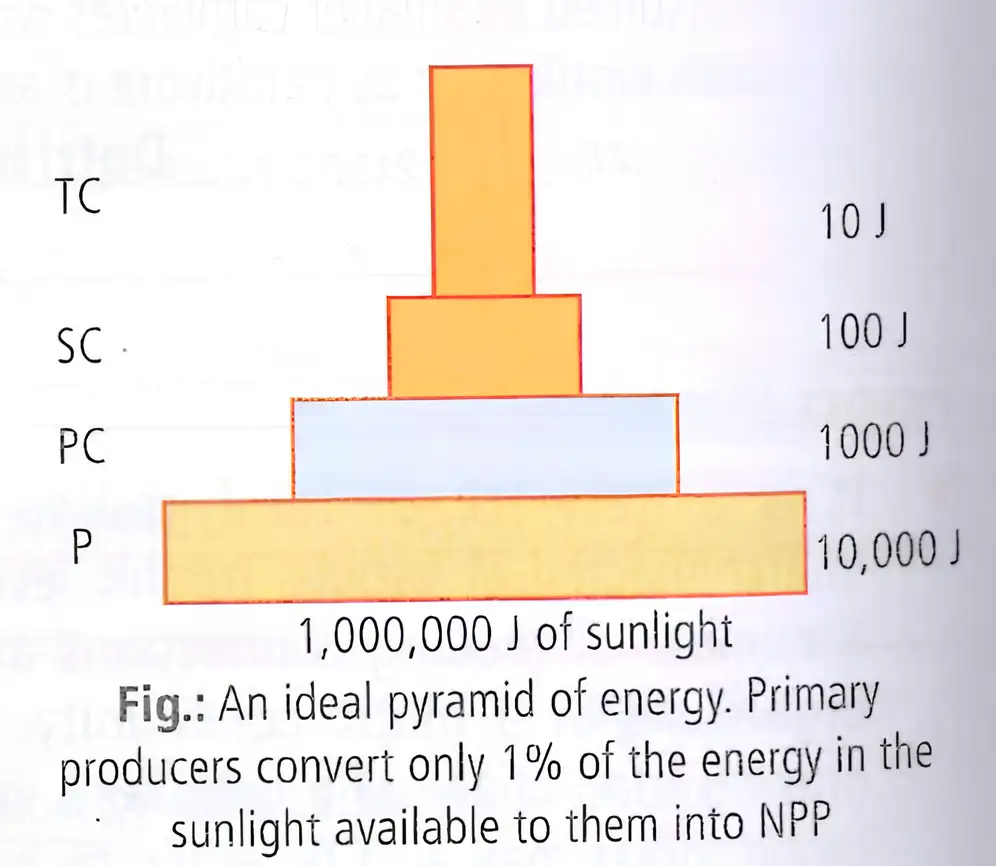
Limitations of Ecological Pyramids
- Multiple trophic levels: They do not account for species that belong to two or more trophic levels.
- Oversimplified food chains: They treat food chains as simple, although this does not reflect nature.
- Saprophytes: They are not given a place in ecological pyramids.
Ecological and Related Efficiencies
Ecological efficiency (trophic level efficiency) — The percentage of energy converted into biomass at a trophic level relative to the energy present in biomass at the lower trophic level.
Compare energy converted into biomass at one trophic level with energy in the biomass at the lower trophic level.
Assimilation efficiency — The percentage of ingested food energy assimilated for body building relative to total food energy ingested.
Photosynthetic efficiency — The percentage ratio of gross primary productivity to incident solar radiation; it represents light energy converted into chemical energy by producers during photosynthesis.
Net production efficiency — The percentage ratio of net primary productivity to gross primary productivity.
- GPP: Gross primary productivity; NPP: Net primary productivity.
- Shape check: Energy pyramids are always upright; biomass pyramids can be inverted in aquatic ecosystems.
Quick recap
- Ecological pyramids represent numbers, biomass or energy across trophic levels; Charles Elton developed them in 1927.
- A trophic level is a functional position, and one species may occupy multiple levels.
- Pyramids of numbers may be upright, inverted or spindle-shaped, depending on the ecosystem.
- Biomass pyramids are usually upright on land but inverted in aquatic ecosystems.
- Energy pyramids are always upright because energy decreases at successive trophic levels.
- Pyramids omit species at multiple trophic levels and saprophytes, and oversimplify food chains.
- Ecological (trophic level), assimilation, photosynthetic and net production efficiencies are percentage ratios.
NEET Zoology — ALL CHAPTERS
1
Structural Organisation in Animals
2
Breathing and Exchange of Gases
3
Body Fluids and Circulation
4
Excretory Products and their Elimination
5
Locomotion and Movement
6
Neural Control and Coordination
7
Human Reproduction
8
Reproductive Health
9
Evolution
10
Microbes in Human Welfare
11
Organism and Population
12
Ecosystem
13
Biodiversity and Conservation