Class 11 Humanities . Economics . Statistics For Economics . Index Numbers
Chapter 7: Index Numbers
Ch 7
Economics
Class 11 Humanities
Introduction
Why Index Numbers Are Needed
- Many changing variables: Prices, industrial output and other related values can move in different directions and at different rates.
- Need for a summary: Reporting every individual change can be confusing; one figure can summarise the overall movement.
- Everyday questions: Index numbers help examine changes in living costs, inflation, production and stock-market values.
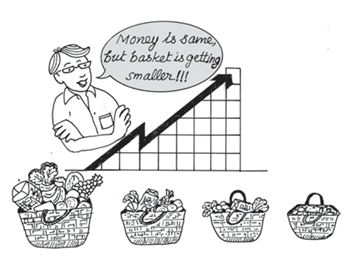
- Example: A worker’s salary rising from Rs. 1,000 to Rs. 12,000 does not by itself show whether the worker’s standard of living rose twelvefold; prices must also be considered.
Examples of questions index numbers help analyse
- Standard of living: How should a salary change to maintain the same purchasing position over time?
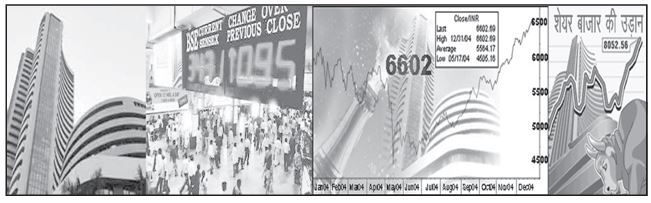
- Sensex: Newspaper reports use the Sensex to summarise stock-market movements; a 600-point fall was reported alongside a loss of Rs. 1,53,690 crores in investors’ wealth.
- Inflation: Price changes, including rises in petroleum prices, raise the question of how inflation is measured.
Meaning and Base Period
Index number — A statistical measure that summarises the average change in the magnitude of a group of related variables between two situations.
Key features
- Summary measure: It represents the general trend of the different ratios used to calculate it.
- Comparisons: It compares related values across two periods or situations, or across categories such as persons, schools and hospitals.
- Examples of variables: It can track prices of selected goods, industrial or agricultural production, construction, employment and cost of living.
- Usual expression: Index numbers are conventionally stated as percentages.
Base period — The period chosen as the reference for comparison; its value is conventionally assigned an index number of 100.
For a single value, compare the period’s value with the base-period value; the base period is assigned 100.
Reading an index number
- Interpretation: An index of 250 means the measured value is 2.5 times its base-period level.
- Example: To measure how prices in 2005 compare with 1990, use 1990 as the base period and assign it an index of 100.
Main Types of Index Numbers
| Type | What it measures | Example or use |
|---|---|---|
| Price index number | Changes in prices of selected goods | Comparing commodity prices; widely used |
| Quantity index number | Changes in physical volume | Production, construction or employment |
- Production index: An important indicator of the economy’s output level.
Quick recap
- An index number summarises the average change in a group of related variables.
- It helps simplify many differing changes into an overall measure.
- The base period is assigned an index of 100.
- An index of 250 represents 2.5 times the base-period value.
- Price indices track prices; quantity indices track physical volumes such as output, construction or employment.
- Price indices are widely used, and production indices indicate the level of economic output.
Construction Of Index Number
Why Construct a Price Index?
- Purpose: A price index summarises changes in the prices of many related commodities in one figure.
- Need: Since prices do not change uniformly, a single measure makes overall price movements easier to understand.
Simple Aggregative Price Index
Example: Simple Aggregative Index
- Calculation: .
- Interpretation: The index is , so the aggregate price level rose by from the base period.
Weighted Aggregative Price Index
| Commodity | Base price | Base quantity | Current price | Current quantity |
|---|---|---|---|---|
| A | 2 | 10 | 4 | 5 |
| B | 5 | 12 | 6 | 10 |
| C | 4 | 20 | 5 | 15 |
| D | 2 | 15 | 3 | 10 |
Laspeyres’ and Paasche’s Price Indices
How to Read the Weighted Indices
- Laspeyres: Asks how much the base-period basket would cost at current prices, relative to its base-period cost.
- Paasche: Asks how much the current-period basket costs at current prices, relative to what that same basket would have cost at base prices.
- Why results differ: The indices use different baskets because current-period quantities can differ from base-period quantities.
- Base period
- The reference period against which prices are compared.
- Current period
- The period whose prices are being compared with the base period.
- Weight
- A quantity used to represent a commodity’s relative importance in an index.
- Price relative
- A comparison of a commodity’s price in one period with its price in another; averaging relatives is another index-construction method.
What is the main limitation of the simple aggregative price index?
Distinguish between Laspeyres’ and Paasche’s price indices.
Quick recap
- A price index summarises changes across many commodity prices in one measure.
- The simple aggregative index compares sums of current and base-period prices but is unweighted.
- A weighted index uses quantities to reflect the relative importance of commodities.
- Laspeyres’ index uses base-period quantities and gives in the example, a rise.
- Paasche’s index uses current-period quantities and gives in the example, a rise.
Method of Averaging Relatives
Simple Average of Price Relatives
Price relative — The price relative of a commodity is its current-period price expressed as a percentage of its base-period price.
Average the price relatives of all commodities; each commodity receives equal weight.
Symbols and interpretation
- and : Prices of commodity in the current and base periods, respectively; is the number of commodities.
- Price relative: .
- Interpretation: An index of means the average price level is higher than in the base period.
Example: Simple average
- Given price ratios: .
- Index: .
- Conclusion: Prices have risen by approximately on average.
Weighted Average of Price Relatives
Weighted price index — A price index calculated as the weighted arithmetic mean of the commodities’ price relatives.
is the weight assigned to commodity .
Choosing weights
- Meaning: Weights commonly represent each commodity’s percentage share of total expenditure, or value share.
- Weight period: Weights may be based on the base or current period, depending on the formula.
- Preferred choice: Base-period weights are generally preferred because recalculating weights every year is inconvenient.
- Comparability: Current-period weights reflect changing baskets, so indices using different baskets are not strictly comparable.
| Commodity | Weight (%) | Base-year price (Rs.) | Current-year price (Rs.) | Price relative |
|---|---|---|---|---|
| A | 40 | 2 | 4 | 200 |
| B | 30 | 5 | 6 | 120 |
| C | 20 | 4 | 5 | 125 |
| D | 10 | 2 | 3 | 150 |
Weighted index calculation
- Calculation: .
- Conclusion: The weighted price index is , so prices have risen by .
- Why it differs: Commodity A has the largest weight and its price doubled, raising the weighted index above the simple average.
Do not treat a weighted index like a simple average: the weighted method gives greater influence to commodities with larger weights.
How is the simple average price index calculated?
Why are base-period weights generally preferred?
Quick recap
- A price relative is the current price as a percentage of the base price.
- The simple average method gives every commodity equal weight.
- A weighted index averages price relatives according to assigned weights.
- Weights often reflect each commodity’s share of total expenditure.
- Base-period weights are generally preferred for convenience and comparability.
- An index of indicates a rise in prices from the base period.
Some Important Index Numbers
Consumer Price Index (CPI)
Consumer Price Index (CPI) — Also called the cost of living index, CPI measures the average change in retail prices for a typical basket of goods and services.
Interpreting CPI
- Basket cost: CPI compares the cost of a typical basket in the current period with its cost in the base period; consumers need not actually buy that exact basket.
- CPI of 277: If the industrial-worker CPI is 277 with 2001 = 100, a basket costing Rs. 100 in 2001 costs Rs. 277 in December 2014.
- Index above 100: It indicates a higher cost of living than in the base period. An index of 150 means a 50% rise, suggesting an equivalent upward wage or salary adjustment.
Here, is the price relative and is its weight. For the example below, the CPI is 97.86, so the cost of living declined by 2.14% from the base period.
Compare each current-period price with its base-period price.
| Item | Weight () | Base price (Rs.) | Current price (Rs.) | Price relative () | |
|---|---|---|---|---|---|
| Food | 35 | 150 | 145 | 96.67 | 3883.45 |
| Fuel | 10 | 25 | 23 | 92.00 | 920.00 |
| Cloth | 20 | 75 | 65 | 86.67 | 1733.40 |
| Rent | 15 | 30 | 30 | 100.00 | 1500.00 |
| Miscellaneous | 20 | 40 | 45 | 112.50 | 2250.00 |
| Total | 100 | 9786.85 |
Consumer Price Indices in India
| Index | Base | Value |
|---|---|---|
| Consumer Price Index for Industrial Workers | 2001 = 100 | 278 |
| All-India CPI for Agricultural Labourers | 1986–87 = 100 | 872 |
| All-India CPI for Rural Labourers | 1986–87 = 100 | 878 |
| All-India Rural Consumer Price Index | 2012 = 100 | 133.3 |
| All-India Urban Consumer Price Index | 2012 = 100 | 129.3 |
| All-India Combined Consumer Price Index | 2012 = 100 | 131.4 |
All-India Combined CPI
- Use: The Reserve Bank of India uses the All-India Combined CPI as its main measure of changes in consumer prices.
- Current series: It uses 2012 = 100 and incorporates improvements aligned with international standards.
- Basis for weights: The basket and weights use Modified Mixed Reference Period data from the Consumer Expenditure Survey, 2011–12, in the 68th National Sample Survey round.
- Coverage: Consumer price indices are also prepared at the state level; calculation methods vary across indices.
| Major group | Weight |
|---|---|
| Food and beverages | 45.86 |
| Pan, tobacco and intoxicants | 2.38 |
| Clothing and footwear | 6.53 |
| Housing | 10.07 |
| Fuel and light | 6.84 |
| Miscellaneous group | 28.32 |
| General | 100.00 |
Using CPI group data
- Price changes: Annual rates of change for sub-groups and main groups help identify which prices are rising fastest and contributing to inflation.
- Consumer Food Price Index (CFPI): It measures food prices like the CPI for “Food and Beverages,” but excludes alcoholic beverages and prepared meals, snacks, sweets, etc.
Wholesale Price Index (WPI)
Wholesale Price Index (WPI) — WPI measures changes in the general price level using prices of goods at the wholesale stage.
| Point | CPI | WPI |
|---|---|---|
| Price stage | Retail prices | Wholesale prices |
| Consumer category | Relates to a specified consumer group or household basket | Has no reference consumer category |
| Coverage | May include goods and services | Includes goods only; excludes services such as barber charges and repairs |
Interpreting and using WPI
- WPI of 253: With 2004–05 = 100, a WPI of 253 in October 2014 means the general price level rose by 153% over the base period.
- Current base: The WPI series uses 2011–12 = 100; its value in May 2017 was 112.8.
- Headline inflation: The inflation rate for all commodities is commonly called headline inflation; wholesale-price data are usually available quickly.
| Major group | Weight |
|---|---|
| Primary articles | 22.62 |
| Fuel and power | 13.15 |
| Manufactured products | 64.23 |
| All commodities (headline inflation) | 100.00 |
| WPI Food Index | 24.23 |
Food and core inflation
- WPI Food Index: Its 24.23% weight combines Food Articles from Primary Articles with Food Products from Manufactured Products.
- Core inflation: Focuses on wholesale prices of manufactured goods, excluding food articles and fuel; it accounts for around 55% of the WPI weight.
- Cost of living index
- Another name for CPI; tracks average retail-price changes for a typical basket.
- Price relative
- Current-period price expressed as a percentage of its base-period price.
- Headline inflation
- Inflation rate based on all commodities in the WPI.
- Core inflation
- Wholesale price inflation for manufactured goods, excluding food articles and fuel.
What does a CPI of 150 indicate?
How does WPI differ from CPI?
Quick recap
- CPI measures average retail-price changes for a typical basket and is also called the cost of living index.
- A CPI above 100 shows an increase from the base period; the excess over 100 gives the percentage rise.
- The All-India Combined CPI uses 2012 = 100 and is the RBI’s main measure of consumer price changes.
- CFPI follows the CPI food-and-beverages measure but excludes alcoholic beverages and prepared meals, snacks and sweets.
- WPI tracks wholesale prices of goods, not services, and does not refer to a particular consumer group.
- All-commodities WPI inflation is headline inflation; core inflation excludes food articles and fuel from manufactured-goods prices.
Index of Industrial production
Index of Industrial Production (IIP)
Index of Industrial Production (IIP) — An index that measures changes in the quantities of industrial production.
- Base year: From April 2017, the base year is 2011–12, with the index set to 100.
- Base-year updates: Industrial products change as some items stop being made or become insignificant, while new products emerge.
- Construction: IIP is a weighted arithmetic mean of quantity relatives, unlike price indices, which use weighted averages of price relatives.
- Weights: Each item's weight is proportional to its value added by manufacture in the base year; the index uses the Laspeyres formula.
- Coverage: IIP is published for industrial sectors and sub-sectors, and also by the intended use of products.
Here, is the quantity relative for item in year 1, using year 0 as the base; is its weight.
| Sector | Weight |
|---|---|
| Mining | 14.4 |
| Manufacturing | 77.6 |
| Electricity | 8.0 |
| General Index | 100.0 |
Core industries
- Eight core industries: Coal, crude oil, natural gas, refinery products, fertilisers, steel, cement and electricity.
- Combined weight: The eight core industries together account for 40.27% of the IIP.
| Group | Weight |
|---|---|
| Primary goods | 34.1 |
| Capital goods | 8.2 |
| Intermediate goods | 17.2 |
| Infrastructure/construction goods | 12.3 |
| Consumer durables | 12.8 |
| Consumer non-durables | 15.3 |
| General Index | 100.0 |
Human Development Index
Human Development Index (HDI) — A widely used index for assessing the development of a country.
Sensex
Sensex — The Bombay Stock Exchange Sensitive Index, a benchmark index for the Indian stock market.
- Base period: The Sensex uses 1978–79 as its base period.
- Composition: It includes 30 stocks representing 13 sectors; the listed companies are leaders in their industries.
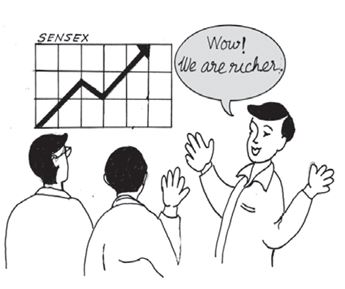
- Rising Sensex: A rise suggests the stock market is doing well, investors expect better company earnings, and confidence in the economy's basic health is growing.
Quick recap
- IIP measures industrial output quantities, using 2011–12 as its base year from April 2017.
- IIP is a weighted mean of quantity relatives, with weights based on base-year value added by manufacture.
- The main IIP sectors are mining, manufacturing and electricity; manufacturing has the largest sector weight.
- The eight core industries together carry 40.27% of the IIP.
- IIP also groups products by use, including primary goods, capital goods and consumer goods.
- HDI is used to assess country development; Sensex is a 30-stock benchmark for the Indian market.
Issues In The Construction Of An Index Number
Issues in Constructing an Index Number
Key choices
- Purpose: Match the index to the question; a volume index is not suitable when a value index is needed.
- Items: Select a representative basket for the group being studied. Items may matter differently to different groups; for example, petrol prices may not directly affect poor agricultural labourers’ living conditions.
- Base year: Choose a normal year, avoiding extreme values, and do not select a period too far in the past.
- Updating: Consumption patterns and available goods change, so update the base year and basket periodically.
- Formula: Choose a formula suited to the question. Laspeyres and Paasche indices differ in the weights they use.
- Data: Collect data carefully; unreliable data can mislead. When using secondary data, choose the most reliable source.
- A representative basket and suitable base year make an index more meaningful.
- Unreliable data can lead to misleading index results.
Uses of Index Numbers in Economics
Inflation — A general and continuing increase in prices; a sufficiently large rise lowers money’s value and can weaken its roles as a medium of exchange and a unit of account.
Here, and are the WPI values for the current and previous weeks.
| Index | Main use |
|---|---|
| Consumer Price Index (CPI) / cost-of-living index | Supports wage negotiations, income and price policies, rent control, taxation, and general economic policy. |
| Wholesale Price Index (WPI) | Measures inflation and adjusts aggregates such as national income and capital formation for price changes. |
| Index of Industrial Production (IIP) | Shows quantitative changes in industrial-sector production. |
| Agricultural production index | Provides a ready measure of agricultural-sector performance. |
| Sensex | Guides stock-market investors; a rising Sensex may signal optimism about future economic performance and an appropriate time to invest. |
With the index expressed on a base of 100, purchasing power is inversely related to the cost-of-living index. Let denote the CPI.
Let be the money wage and the cost-of-living index. The result expresses the wage in base-period purchasing power.
CPI example
- Given: If CPI with base is in January , one rupee then has purchasing power of rupees in —about paise.
- Real wage: A money wage of Rs. corresponds to Rs. in base-period purchasing power.
- Comparison: A worker earning Rs. in would need about Rs. in January to maintain the same standard of living.
Dates in the CPI example
- 1982The CPI example uses this as the base year, with the index set to 100.
- January 2005The example CPI is 526; wages and purchasing power are compared with the 1982 base.
State four important considerations when constructing an index number.
Give two uses each of the CPI and WPI.
Quick recap
- An index must match its purpose and include items representative of the group being studied.
- Choose a normal, reasonably recent base year and update it when consumption patterns change.
- Laspeyres and Paasche indices differ in their weights; reliable data are essential.
- CPI supports cost-of-living comparisons and the calculation of purchasing power and real wages.
- WPI is used to measure inflation and adjust aggregates for price changes.
- IIP, agricultural production indices, and Sensex track industrial output, agricultural performance, and stock-market trends.
Where can we get these index numbers?
Sources of Index Numbers
- Economic Survey: It publishes widely used index numbers, including WPI, CPI and the Index of Industrial Production.
- Other indices: The Economic Survey also provides the Index Number of Yield of Principal Crops and the Index of Foreign Trade.
Meaning, Interpretation and Uses
Do not interpret an index without checking its included items, base period and formula; these choices influence the comparison.
Name five widely used index numbers available in the Economic Survey.
Why must index numbers be interpreted carefully?
Quick recap
- Index numbers summarise relative change across many items.
- They can measure changes in prices, quantities, volumes and other variables.
- The Economic Survey publishes WPI, CPI, IIP, crop-yield and foreign-trade indices.
- Sensex is another widely used index.
- Interpret indices with attention to the items, base period and formula.
- Index numbers are important in economic policy-making.
Economics — ALL CHAPTERS
1
Introduction
2
Theory of Consumer Behaviour
3
Production And Costs
4
The Theory Of The Firm Under Perfect Competition
5
Market Equilibrium
1
Introduction
2
Collection of Data
3
Organizing of Data
4
Presentation of Data
5
Measures of Central Tendency
6
Correlation
7
Index Numbers
8
Use of Statistical Tools