Class 11 Humanities . Economics . Statistics For Economics . Introduction
Chapter 1: Introduction
Ch 1
Economics
Class 11 Humanities
Why Economics ?
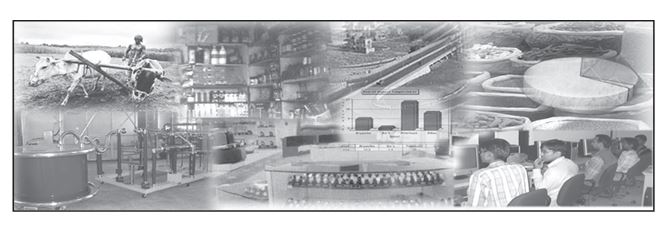
Scope of Economics
Economics — The study of people’s ordinary economic activities, including consumption, production and distribution.
Roles in economic life
- Alfred Marshall: A founder of modern economics; he described it as the study of people in the ordinary business of life.
- Consumer: A person who buys goods to satisfy their own or another person’s wants.
- Seller: A person who sells goods, generally to earn a profit.
- Producer: A person or organisation that makes goods or provides services, such as farming, healthcare or transport.
- Employee: A person who works for someone else in return for wages or a salary.
- Employer: A person who hires workers and pays them.
Economic activity — An activity undertaken for monetary gain; people engaged in such activity are gainfully employed.
Scarcity, Choice and Economic Problems
Scarcity — A situation in which resources or goods available to satisfy people’s wants are limited.
Why scarcity matters
- Wants and means: People have many wants, but income and available goods are limited.
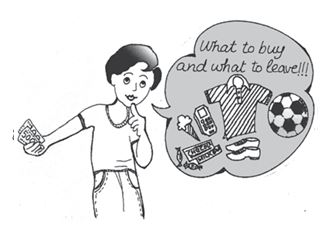
- Choice: A limited budget requires consumers to choose what and how much to buy at current prices.
- Economic problem: Scarcity makes choice necessary; without scarcity, there would be no economic problem.
- Everyday examples: Railway booking queues, crowded buses and trains, shortages of essential goods, and high demand for film tickets.
From scarcity to choice
- People have numerous wants.
- Income and available goods are limited.
- Not all wants can be satisfied.
- People must choose how to use their available means.
Resources and Alternative Uses
Alternative uses — Different possible ways of using the same resource to produce different goods.
Production choices
- Limited resources: At a given time, producers have limited land, labour, water, fertiliser and other resources.
- Food production: Agricultural resources can be used to grow crops that provide food and nourishment.
- Alternative production: The same resources could instead produce non-food crops such as rubber, cotton or jute.
- Result: Since resources have alternative uses, producers must choose which goods to produce.
How alternative uses create choice
- Resources are limited.
- The same resources can be used for different purposes.
- Using resources for one good leaves fewer resources available for another.
- Producers must choose which commodities to make.
- Consumer
- A person who buys goods to satisfy wants.
- Producer
- A person or organisation that makes goods or provides services.
- Economic activity
- An activity undertaken for monetary gain.
- Scarcity
- Limited availability of resources or goods relative to wants.
- Alternative uses
- Different possible uses of the same resource.
Why is scarcity the root of economic problems?
How do alternative uses of resources create a production choice?
Quick recap
- Economics studies ordinary economic activities, including consumption, production and distribution.
- Consumers buy goods; sellers sell them; producers make goods or provide services.
- Economic activities are undertaken for monetary gain.
- Limited income and goods mean people cannot satisfy every want.
- Scarcity makes choice necessary and is the root of economic problems.
- Resources can have alternative uses, so producers must choose what to produce.
Consumption, Production and Distribution
The Three Main Areas of Economics
| Area | What it studies |
|---|---|
| Consumption | How a consumer uses income and prices to choose which goods to buy from the available alternatives. |
| Production | How producers choose what to produce and how to produce it for the market. |
| Distribution | How income generated by production is shared among people and groups. |
Income Distribution
- National income is the total income arising from goods and services produced within a country; it is also called Gross Domestic Product (GDP) in this context.
- Main forms of income include wages and salaries, profits, and interest.
- Scope here excludes income from international trade and investment.
Modern Economics and Statistics
Broader Economic Studies
- Social conditions: Economics uses facts to study poverty, income differences, and how many people are poor, middle-class, or relatively rich.
- Education and work: It examines literacy, education needs, unemployment, and how education affects job opportunities and earning capacity.
- Disasters and the environment: It can assess how events such as tsunamis, earthquakes, and disease outbreaks affect lives and economic activity.
- Purpose: Reliable evidence helps governments choose suitable actions and helps people make better plans for their own lives.
Statistics — The systematic study of numbers relating to selected facts.
Why Statistics Matters in Economics
- Reliable measurement requires facts to be collected and organised systematically and correctly.
- Applications include measuring poverty, income distribution, education-related earning opportunities, and the economic effects of disasters.
Definition of Economics
Economics — The study of how people and society choose to use scarce resources with alternative uses to produce goods and services that satisfy wants and distribute them for consumption among people and groups.
- Scarce resources
- Limited resources that cannot satisfy every want.
- Alternative uses
- Different possible ways of using a resource.
- GDP
- Gross Domestic Product; total income arising from production within a country in this lecture's context.
- Statistics
- Systematic study of numbers relating to selected facts.
What are the three conventional divisions of economics?
Why is statistics important in modern economics?
Quick recap
- Economics is commonly divided into consumption, production, and distribution.
- Consumers choose what to buy based on income, prices, and available goods.
- Producers choose what and how to produce for the market.
- Distribution concerns sharing income from production through wages and salaries, profits, and interest.
- Modern economics studies poverty, inequality, education, employment, and disaster impacts.
- Statistics organises numerical facts systematically to support economic study and decisions.
- Economics concerns choices about scarce resources with alternative uses to satisfy wants.
Statistics In Economics
Economics, Data and Policies
Economic data — Facts and information about economic issues and conditions are called economic data.
Policy — A policy is a measure designed to help solve or reduce an economic problem.
How Statistics Supports Economic Policy
- Collect data about an economic problem and its underlying factors.
- Analyse the data to identify causes and explain the problem.
- Formulate policies using the analysis to address the problem.
Why Data Matters in Economics
- Analysis needs data: Economic problems cannot be properly analysed without information about their causes and related factors.
- Example—poverty: Its causes may include unemployment, low productivity and backward technology.
- Policy depends on analysis: Without data-based analysis, it is difficult to design measures to solve an economic problem.
Meaning and Scope of Statistics
Statistics — Statistics deals with the collection, analysis, interpretation and presentation of numerical data.
Statistics in Economics
- Nature: Statistics is a branch of mathematics and is also used in economics, accounting, management, physics, finance, psychology and sociology.
- Economic information: Economics uses both numerical information and information about attributes that may not be measured numerically.
Types of Economic Data
| Type | Meaning | Examples |
|---|---|---|
| Quantitative | Information expressed in measurable numerical form. | Income, prices, taxes paid, marks; rice production rose from 39.58 million tonnes in 1974–75 to 106.5 million tonnes in 2013–14. |
| Qualitative | Information describing attributes or qualities that cannot be measured directly in numerical terms. | Gender, beauty, intelligence, ability to sing and learning skills; skill may be described as unskilled, skilled or highly skilled. |
Understanding Qualitative Information
- Attributes: Qualitative data describe characteristics of a person or group, such as gender or level of skill.
- Degrees: Some qualities can be recorded in ordered categories, such as sick/healthy or worse/better.
- Systematic records: Qualitative information can be collected and stored systematically, just like numerical information.
- Classification: Income earned and marks in a subject are quantitative; beauty, intelligence, ability to sing and learning skills are qualitative.
Stages in Statistical Work
From Data to Conclusions
- Collect data.
- Present data in tables, diagrams or graphs.
- Summarise the data using numerical measures such as mean, variance and standard deviation.
- Analyse and interpret the results to understand the information.
How are Statistics and Economics connected?
Quick recap
- Economic data are facts about economic issues; policies are measures intended to address them.
- Economic analysis requires data about a problem and its underlying causes.
- Statistics involves collecting, analysing, interpreting and presenting numerical data.
- Economic data may be quantitative or qualitative, and both can be recorded systematically.
- Statistical work proceeds from collection to presentation, summarisation, analysis and interpretation.
What Statistics Does ?
Statistics in economics — Statistics uses data and statistical methods to understand economic problems, identify their causes and support decisions.
Understanding and presenting economic problems
Making facts precise
- Precision: Statistical figures express economic facts in a definite, exact form, making them easier to understand and more convincing.
- Example: “310 people died in the Kashmir earthquake” is precise; “hundreds died” is vague.
- Evidence: Statistics can use both qualitative and quantitative facts to investigate the causes of an economic problem.
| Point | Precise statement | Vague statement |
|---|---|---|
| Example | 310 people died | Hundreds of people died |
| Use | Specific and more convincing | Less exact and less informative |
Summarising large amounts of data
- Condensation: Statistics reduces a large mass of data to a few useful numerical measures, such as the mean or variance.
- Use: A summary such as average income is easier to understand and remember than the individual incomes of many people.
- Result: These measures communicate meaningful overall information, but may not describe every individual value.
Finding relationships and making predictions
Testing economic relationships
- Relationships: Statistical methods help determine whether changes in one economic factor are associated with changes in another.
- Examples: Economists can examine how price affects demand or supply, how average income relates to consumption expenditure, and how government spending relates to the general price level.
- Testing assumptions: An economist can use data to check whether an assumed relationship is supported.
Predicting changes and future trends
- Prediction: Statistics helps estimate how a change in one factor may affect another—for example, how current investment may influence future national income.
- Planning example: A planner deciding in 2017 how much to produce in 2020 needs an estimate of consumption in 2020.
- Data for forecasts: Estimates can use past or recent consumption data, including information collected through surveys; statistical tools provide an alternative to guesswork.
Policy decisions and evaluation
Using statistics to address economic problems
- Collect and analyse data about a problem, such as rising prices, population growth, unemployment or poverty.
- Identify causes and estimate likely future trends.
- Use the findings to formulate suitable plans and policies.
- Analyse later data to assess whether the policy worked—for example, whether family planning helped check population growth.
Statistics in decision-making
- Policy decisions: Reliable estimates help decision-makers choose actions based on expected needs and available resources.
- Oil-import example: Deciding how much oil India should import in 2025 requires estimates of domestic production and likely demand.
- Importance: Without statistical information about requirements, such decisions cannot be made reliably.
Do not treat an average as a guarantee for every case. In the river story, comparing the family’s average height with the river’s average depth could not ensure that each person—especially each child—could cross safely. The error was misusing an average, not calculating it.
- Statistics is a tool, not a substitute for common sense.
- Use statistical findings carefully: summaries and averages can hide important differences between individual cases.
- Scarcity
- The condition in which resources are limited while human wants are unlimited; it is the root of economic problems.
- Alternative uses
- Resources can be used for different purposes.
- Consumption
- Consumers’ purchase of goods to satisfy their needs.
- Production
- Manufacture of goods by producers for the market.
- Distribution
- Division of national income into wages, profits, rent and interest.
State four important uses of Statistics in economics.
Why can an average be misleading when applied to individual cases?
Quick recap
- Statistics helps economists understand problems, identify causes and make facts precise.
- Numerical measures summarise large data sets, while relationships between factors can be tested using data.
- Statistical tools support predictions, economic plans, policy decisions and evaluation of policies.
- Use statistical results with common sense: an average may hide individual differences.
- Scarcity and resources’ alternative uses are central economic concerns; consumption, production and distribution describe key economic activities.
Economics — ALL CHAPTERS
1
Introduction
2
Theory of Consumer Behaviour
3
Production And Costs
4
The Theory Of The Firm Under Perfect Competition
5
Market Equilibrium
1
Introduction
2
Collection of Data
3
Organizing of Data
4
Presentation of Data
5
Measures of Central Tendency
6
Correlation
7
Index Numbers
8
Use of Statistical Tools