Class 11 Humanities . Economics . Introductory Micro Economics . Market Equilibrium
Chapter 5: Market Equilibrium
Ch 5
Economics
Class 11 Humanities
Introduction & Equilibrium, Excess Demand, Excess Supply
Demand, Supply and Market Behaviour
| Market side | Individual plan | Market total |
|---|---|---|
| Demand | A consumer's planned purchase at each price | Total quantity all consumers plan to buy |
| Supply | A firm's planned sale at each price | Total quantity all firms plan to sell |
Market Equilibrium
Market equilibrium — A situation in which the plans of all consumers and firms match, so the market clears: quantity demanded equals quantity supplied.
- Equilibrium price: The price at which market demand equals market supply.
- Equilibrium quantity: The quantity bought and sold at the equilibrium price.
- Equilibrium condition: At equilibrium price , market demand equals market supply: .
Excess Demand and Excess Supply
| Point | Excess demand | Excess supply |
|---|---|---|
| Quantity relationship | Market demand exceeds market supply | Market supply exceeds market demand |
| Price pressure | Price tends to rise | Price tends to fall |
- Equilibrium alternative: Equilibrium is a zero-excess-demand and zero-excess-supply situation.
- Disequilibrium: When market demand and supply are unequal, the price tends to change.
Out-of-Equilibrium Price Changes
Invisible hand — The market force assumed to change prices when demand and supply are imbalanced.
Price Adjustment
- Excess demand → price rises → the market moves toward equilibrium.
- Excess supply → price falls → the market moves toward equilibrium.
Assumption about Price Adjustment
- Assumption: The invisible hand adjusts prices in this way and is assumed to be able to reach equilibrium.
Quick recap
- Consumers maximise preferences and firms maximise profits; both act as price takers.
- Market demand and supply combine the individual purchase and sale plans at each price.
- Equilibrium occurs when market demand equals market supply at the equilibrium price.
- Equilibrium quantity is the amount bought and sold at that price.
- Excess demand pushes price upward; excess supply pushes price downward.
- The invisible hand is assumed to adjust prices and to be able to reach equilibrium.
Market Equilibrium: Fixed Number of Firms
Market Equilibrium with a Fixed Number of Firms
Market equilibrium — The market is in equilibrium when quantity demanded equals quantity supplied at the equilibrium price and quantity.
Price adjustment
- Market supply () shows how much firms wish to sell at different prices; market demand () shows how much consumers wish to buy.
- Equilibrium occurs where and intersect: demand equals supply, giving and .
- Below equilibrium price: quantity demanded exceeds quantity supplied. Excess demand encourages consumers to offer more, so price rises.
- As price rises: quantity demanded falls and quantity supplied rises, moving the market towards equilibrium.
- Above equilibrium price: quantity supplied exceeds quantity demanded. Firms unable to sell their desired output lower prices.
- As price falls: quantity demanded rises and quantity supplied falls, moving the market towards equilibrium.
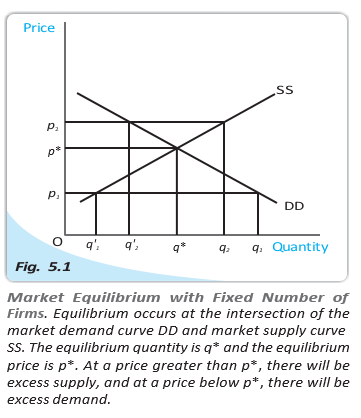
At the equilibrium price, market demand equals market supply.
Wheat Market Example
Demand and supply
- Market: Identical farms produce wheat of the same quality; quantities are measured in kilograms and price in rupees per kilogram.
- Demand: for ; demand is zero for .
- Supply: for ; supply is zero for .
Set demand equal to supply and solve for the price.
Equilibrium outcome and disequilibrium
- Equilibrium price: per kg.
- Equilibrium quantity: kg; using supply also gives kg.
- At : demand is kg and supply is kg, so excess demand is kg.
- At : demand is kg and supply is kg, so excess supply is kg.
For the relevant price ranges, prices below give positive excess demand; prices above give positive excess supply.
Price and imbalance
Price below equilibrium → shortage (excess demand); price above equilibrium → surplus (excess supply).
Wage Determination in the Labour Market
| Market | Suppliers | Demanders |
|---|---|---|
| Labour | Households | Firms |
| Goods | Firms | Households/consumers |
Meaning and equilibrium
- Labour means hours of work supplied, not the number of workers.
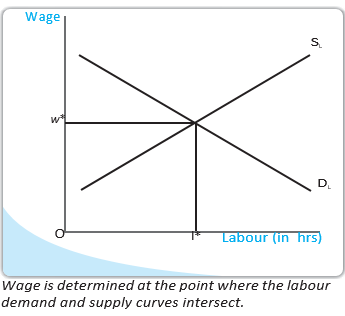
- Wage rate () is determined where firms’ demand for labour equals households’ supply of labour.
Firms’ Demand for Labour
Hiring decision
- Assumptions: Labour is the only variable input; both the labour market and firm are perfectly competitive; the firm maximises profit; diminishing marginal product holds.
- Hiring rule: Employ labour up to the point where the extra cost of the last unit—the wage—equals its extra benefit to the firm.
- Marginal revenue product of labour (): Additional revenue from employing one more unit of labour; it equals marginal product times marginal revenue.
- Competitive firm: Since , equals the value of marginal product, .
- Profit choice: If , hiring another unit raises profit; if , reducing labour raises profit.
For a perfectly competitive firm, hire labour until wage equals the value of its marginal product.
Why Labour Demand Slopes Downward
- Wage rises while the output price remains constant.
- To restore , the value of marginal product must rise.
- With diminishing marginal product, this requires employing fewer workers’ hours, which raises .
- Thus, a higher wage leads each firm to demand less labour; adding firms’ demands gives a downward-sloping market demand curve.
Households’ Supply of Labour
Income–leisure choice
- Trade-off: Individuals value income but also enjoy leisure; work provides income and takes time away from leisure.
- Higher wage—substitution effect: Leisure becomes more costly, encouraging the individual to work more hours.
- Higher wage—income effect: Greater purchasing power can increase demand for leisure, encouraging the individual to work fewer hours.
- Individual supply: At low wages, the substitution effect tends to dominate, so labour supplied rises with wages; at high wages, the income effect may dominate.
- Market supply: Although an individual’s curve may bend backwards, the market supply curve slopes upward because higher wages attract more people or hours into work overall.
| Point | Individual | Market |
|---|---|---|
| Shape | Backward-bending: labour supplied may fall at sufficiently high wages. | Upward-sloping: higher wages generally attract more labour overall. |
| Reason | The income effect can outweigh the substitution effect. | More individuals are attracted to supply labour as wages rise. |
Labour-market equilibrium
- Equilibrium wage: Set at the intersection of the upward-sloping market labour-supply curve and downward-sloping labour-demand curve.
- Equilibrium condition: The hours households wish to supply equal the hours firms wish to hire.
- Excess demand
- Quantity demanded is greater than quantity supplied at the prevailing price.
- Excess supply
- Quantity supplied is greater than quantity demanded at the prevailing price.
- Marginal product of labour
- Additional output produced by employing one more unit of labour.
- Marginal revenue product of labour
- Additional revenue generated by employing one more unit of labour.
- Value of marginal product of labour
- Marginal product of labour multiplied by the output price.
How does excess demand move a market towards equilibrium?
Why does a competitive firm’s demand for labour slope downward?
Why can an individual’s labour supply curve bend backwards?
Quick recap
- Market equilibrium occurs where demand equals supply; prices below it create excess demand and prices above it create excess supply.
- In the wheat example, equilibrium price is Rs. 40 per kg and equilibrium quantity is 160 kg.
- In a labour market, households supply labour hours and firms demand them.
- A competitive firm hires labour until the wage equals the value of marginal product of labour.
- Diminishing marginal product makes each firm’s labour demand curve downward-sloping.
- An individual labour-supply curve may bend backwards, while the market labour-supply curve slopes upward.
- The equilibrium wage is where market labour demand equals market labour supply.
Shifts In Demand And Supply
How Shifts Affect Market Equilibrium
- Shifts: Changes in factors affecting consumers or firms can shift market demand or supply.
- Equilibrium: A shift changes the market-clearing price and quantity; the effects depend on which curve shifts and in what direction.
Demand Shifts and Equilibrium
| Effect | Rightward shift | Leftward shift |
|---|---|---|
| Demand at each price | Increases | Decreases |
| At the original equilibrium price | Excess demand | Excess supply |
| New equilibrium price | Rises | Falls |
| New equilibrium quantity | Rises | Falls |
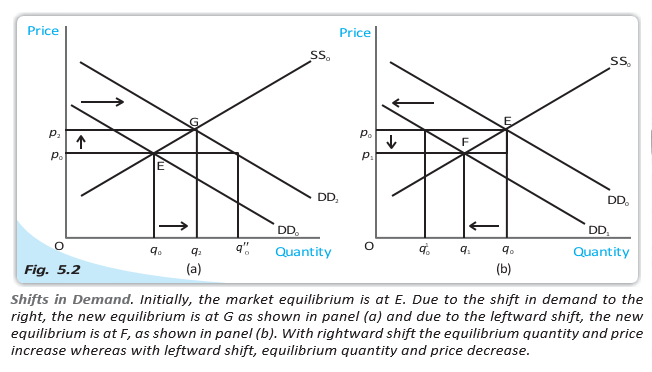
A change in the good’s own price causes a movement along its demand curve; a change in another demand factor shifts the whole curve.
Income and Number of Consumers
Normal Good: Higher Income
- Consumer income rises
- Demand for a normal good increases at each price
- Market demand shifts rightward while supply stays unchanged
- Equilibrium price and quantity rise
Increase in Number of Consumers
- The number of consumers rises
- More of the good is demanded at each price
- Market demand shifts rightward while supply stays unchanged
- Equilibrium price and quantity rise
What happens to equilibrium when demand shifts right and supply is unchanged?
How does higher income affect demand for normal and inferior goods?
Why does an increase in the number of consumers shift demand rather than supply?
Quick recap
- A demand shift changes quantity demanded at every price; it is not caused by a change in the good’s own price.
- With supply unchanged, a rightward demand shift raises equilibrium price and quantity.
- With supply unchanged, a leftward demand shift lowers equilibrium price and quantity.
- Higher income raises demand for normal goods but lowers demand for inferior goods.
- More consumers shift market demand rightward; consumer-side changes do not themselves shift supply.
Supply Shift
How a Supply Shift Changes Equilibrium
Supply shift — A change in market supply at every price, shown by the supply curve moving left or right.
Supply shifts with demand unchanged
- Starting point: Demand curve and supply curve meet at , giving equilibrium price and quantity .
- Supply shifts left: At , excess demand develops. Buyers compete for the limited goods, pushing price up to ; equilibrium quantity falls to .
- Supply shifts right: At , excess supply develops. Firms lower prices, so equilibrium price falls to and quantity rises to .
- Key result: With demand unchanged, a supply shift changes equilibrium price and quantity in opposite directions.
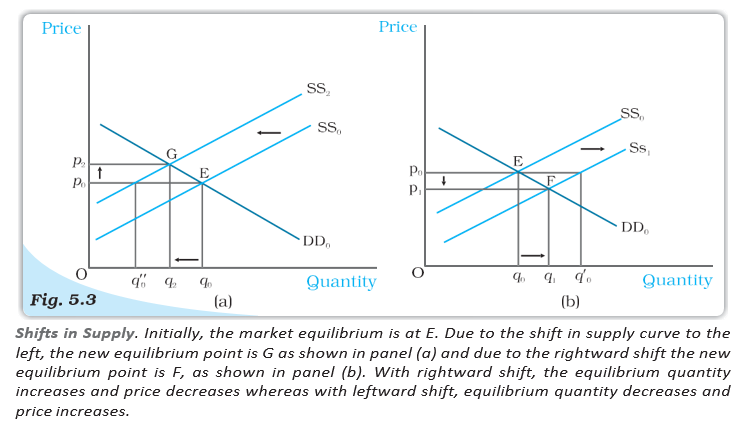
Causes of Supply Shifts
Increase in input price
- Input price rises
- Firms’ marginal production costs rise
- Market supply falls at every price; supply shifts left
- Demand is unchanged because consumer demand does not directly depend on input prices
- Equilibrium price rises and quantity produced falls
Increase in the number of firms
- More firms enter or operate in the market
- More firms supply the commodity at each price
- Market supply rises; the supply curve shifts right
- Demand is unchanged
- Equilibrium price falls and quantity produced rises
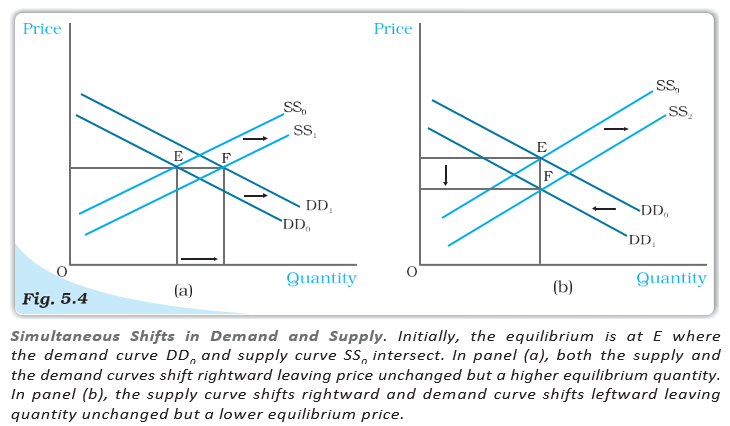
Simultaneous Shifts in Demand and Supply
| Demand shift | Supply shift | Equilibrium quantity | Equilibrium price |
|---|---|---|---|
| Left | Left | Decreases | May increase, decrease, or remain unchanged |
| Right | Right | Increases | May increase, decrease, or remain unchanged |
| Left | Right | May increase, decrease, or remain unchanged | Decreases |
| Right | Left | May increase, decrease, or remain unchanged | Increases |
How to determine the uncertain change
- Both curves shift in the same direction: Quantity has a definite direction; price depends on the relative magnitudes of the shifts.
- Curves shift in opposite directions: Price has a definite direction; quantity depends on the relative magnitudes of the shifts.
- Example: If demand and supply both shift right by suitable amounts, quantity rises while price may remain unchanged.
- Excess demand
- Quantity demanded exceeds quantity supplied at the current price.
- Excess supply
- Quantity supplied exceeds quantity demanded at the current price.
- Magnitude of shift
- The size of a curve’s movement, which can determine the direction of an otherwise uncertain equilibrium change.
What happens to equilibrium when supply decreases and demand is unchanged?
If demand and supply both shift right, what happens to equilibrium quantity and price?
Quick recap
- A leftward supply shift raises equilibrium price and lowers quantity when demand is unchanged.
- A rightward supply shift lowers equilibrium price and raises quantity when demand is unchanged.
- Higher input prices raise production costs, shifting supply left.
- An increase in the number of firms shifts supply right.
- Same-direction demand and supply shifts give a definite quantity change but an uncertain price change.
- Opposite-direction shifts give a definite price change but an uncertain quantity change.
Market Equilibrium: Free Entry And Exit
Equilibrium with Free Entry and Exit
How Entry and Exit Restore Equilibrium
- Supernormal profit: At a price above minimum average cost, new firms enter; market supply rises and price falls until profit becomes normal.
- Losses: At a price below minimum average cost, firms exit; market supply falls and price rises until firms earn normal profit.
- No incentive to adjust: With normal profit, no new firms are attracted and existing firms have no reason to leave.
Normal profit — The level of profit at which firms neither earn supernormal profit nor incur a loss; with free entry and exit, it occurs when price equals minimum average cost.
Free entry and exit make the market price equal the firms’ minimum average cost.
Market Output and Number of Firms
- Market quantity: At the equilibrium price, market demand determines total output; quantity demanded equals quantity supplied.
- Firm output: Each identical firm supplies the same amount at the equilibrium price.
- Firm count: The equilibrium number of firms is total market output divided by output per firm.
Here, is total market output and is output supplied by each firm.
Example: Wheat Market
The wheat market has the following demand and single-firm supply functions.
Equilibrium Calculation
- Price: Free entry and exit imply , the minimum average cost; firms do not produce below this price.
- Market quantity: At , demand is kg.
- Output per firm: At , each firm supplies kg.
- Number of firms: . The equilibrium is price Rs. 20, output 180 kg and 6 firms.
Effects of Demand Shifts
| Change | Market adjustment | New equilibrium |
|---|---|---|
| Rightward shift | Excess demand at creates a tendency for price and profits to rise; entry increases supply and restores price to . | Quantity and number of firms increase. |
| Leftward shift | Excess supply at creates a tendency for price to fall; exit reduces supply and restores price to . | Quantity and number of firms decrease. |
- Demand shift with free entry and exit: Equilibrium price remains at minimum average cost; equilibrium quantity and firm numbers adjust in the direction of the demand shift.
- Compared with fixed firm numbers: A demand shift has a larger effect on equilibrium quantity when firms can enter and exit, and does not change equilibrium price.
Quick recap
- Free entry and exit eliminate supernormal profit and losses, leaving firms with normal profit.
- Long-run equilibrium price is the minimum average cost: .
- Market output is determined by demand at that price, where quantity demanded equals quantity supplied.
- Equilibrium firm count is .
- A rightward demand shift increases quantity and firm numbers; a leftward shift decreases both.
- With free entry and exit, demand shifts leave price unchanged and affect quantity more than with a fixed number of firms.
Applications
Government Price Controls
- Price controls: The government may regulate prices when market prices are considered too high or too low.
- Market effects: Government-imposed price limits can create imbalances between quantity demanded and quantity supplied.
Price Ceiling
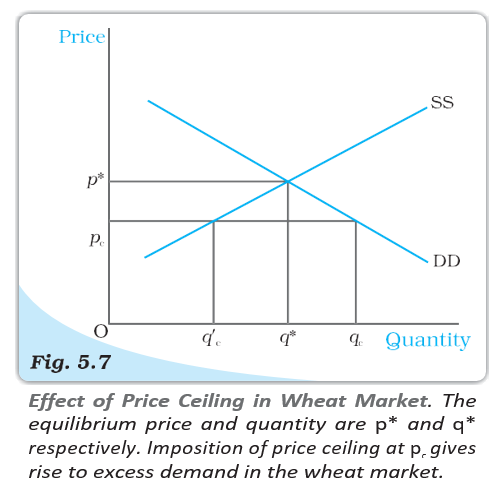
Effects of a Price Ceiling
- Ceiling set below equilibrium → quantity demanded exceeds quantity supplied.
- Shortage → government may ration the available quantity using coupons and fair-price shops.
- Rationing → long queues and some consumers remain unsatisfied.
- Unsatisfied consumers may be willing to pay more → a black market may develop.
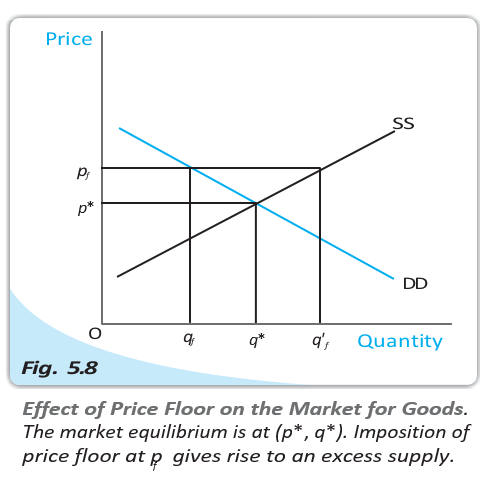
Price Floor
| Point | Price ceiling | Price floor |
|---|---|---|
| Price limit | Maximum price, usually below equilibrium | Minimum price, usually above equilibrium |
| Market result | Excess demand (shortage) | Excess supply (surplus) |
| Example | Essential goods such as wheat | Agricultural support prices and minimum wages |
| Government response mentioned | Rationing through coupons and fair-price shops | Government buys agricultural surplus |
Market Equilibrium: Key Results
Free Entry and Exit
- Long-run price: With identical firms and free entry and exit, equilibrium price equals the firms’ minimum average cost.
- Demand shift: A change in demand does not affect equilibrium price; equilibrium quantity and the number of firms change in the same direction as demand.
- Quantity response: A demand shift has a more pronounced effect on equilibrium quantity when firms can enter and exit than when the number of firms is fixed.
- Excess demand
- Quantity demanded exceeds quantity supplied at the given price.
- Excess supply
- Quantity supplied exceeds quantity demanded at the given price.
- Marginal revenue product of labour
- The measure that a firm compares with the wage rate when deciding how much labour to employ.
- Value of marginal product of labour
- A key labour-market concept listed in this lecture’s summary.
- Minimum average cost
- The lowest average cost of firms; with free entry and exit, it equals the equilibrium price.
What happens when a binding price ceiling is imposed?
What happens when a binding price floor is imposed?
Quick recap
- A price ceiling below equilibrium creates excess demand and may require rationing.
- Queues, unmet demand and black markets are possible adverse effects of ceiling-based rationing.
- A price floor above equilibrium creates excess supply; government may buy agricultural surpluses.
- With fixed firms, demand shifts change price and quantity in the same direction; supply shifts change them in opposite directions.
- When demand and supply shift together, quantity’s direction is certain; when they shift oppositely, price’s direction is certain.
- With identical firms and free entry and exit, equilibrium price equals minimum average cost.
Economics — ALL CHAPTERS
1
Introduction
2
Theory of Consumer Behaviour
3
Production And Costs
4
The Theory Of The Firm Under Perfect Competition
5
Market Equilibrium
1
Introduction
2
Collection of Data
3
Organizing of Data
4
Presentation of Data
5
Measures of Central Tendency
6
Correlation
7
Index Numbers
8
Use of Statistical Tools