Class 11 Humanities . Economics . Statistics For Economics . Use of Statistical Tools
Chapter 8: Use of Statistical Tools
Ch 8
Economics
Class 11 Humanities
Introduction
Why Use Statistical Tools?
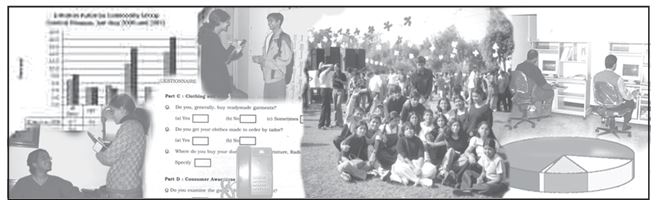
Steps in Developing a Project
Project objective — The clearly stated purpose of a study that guides the data to be collected and how it will be processed.
1. Identify the Problem or Area of Study
- Start with a clear objective: Decide what you want to find out before planning data collection.
- Possible areas: Product production or sales; household water or electricity problems; or consumer awareness of rights.
- Examples of products: Cars, mobile phones, shoe polish, soap and detergent.
Target group — The people on whom a project focuses and from whom relevant information is collected.
2. Choose the Target Group
- Importance: The target group determines who will be surveyed and helps frame suitable questionnaire questions.
- Cars: Focus mainly on middle- and higher-income groups.
- Soap: Include rural and urban consumers.
- Safe drinking water: Include both urban and rural populations.
3. Collect Data
| Point | Primary data | Secondary data |
|---|---|---|
| Source | Collected first-hand for the study | Obtained from information already available |
| When useful | When the project needs direct information from its target group | When suitable information is available and resources such as time, money or manpower are limited |
| Examples | Surveying households about literacy or soap consumption | Using relevant magazines, newspapers or research reports |
4. Organise and Present Data
- Process the information: Arrange the collected data in a clear, usable form.
- Presentation: Use tables and suitable diagrams, including bar diagrams and pie diagrams.
5. Analyse and Interpret
- Central tendency: Measures such as the mean help calculate an average.
- Dispersion: Measures such as standard deviation show variability in the data.
- Correlation: Helps examine whether a relationship exists between variables.
6. Draw Conclusions
- Conclude: Draw meaningful conclusions from the analysis and interpretation of results.
- Extend findings: Where possible, suggest future prospects and recommendations about growth or government policies based on the collected information.
7. Prepare the Bibliography
- Bibliography: List the details of all secondary sources used, such as magazines, newspapers and research reports.
Project Sequence
- Identify the problem and objective
- Choose the target group
- Collect suitable data
- Organise and present the data
- Analyse and interpret the results
- Draw conclusions and make suggestions
- List secondary sources in the bibliography
- Target group
- The people selected as the focus of the project.
- Primary data
- First-hand data collected for a study.
- Secondary data
- Previously collected or published information used for a study.
- Bibliography
- A list of the secondary sources used in a project.
What determines the choice of target group?
When may secondary data be preferred?
Quick recap
- A clear project objective guides data collection and processing.
- Choose a target group that matches the project problem.
- Collect primary data first-hand, use suitable secondary data, or combine both.
- Organise data in tables and suitable diagrams.
- Use mean, standard deviation and correlation to analyse different features of data.
- Draw evidence-based conclusions and include recommendations where possible.
- List all secondary sources in the bibliography.
Suggested List Of Projects
Suggested Economic Project Areas
| No. | Project focus | Suggested output |
|---|---|---|
| 1 | Transport | As an adviser to the Transport Minister, report on creating a better, coordinated transport system. |
| 2 | Village cottage industry | Propose a new unit, such as dhoop, agarbatti, candles or jute products, to support a bank-loan application. |
| 3 | Advertising and sales | Report on how advertisements for a consumer product affect its sales. |
| 4 | Education | Assess literacy levels and reasons children drop out of school. |
| 5 | Overcharging | Investigate complaints that traders charge more than the Maximum Retail Price (MRP). |
| 6 | Village amenities | Report on improving amenities, such as safe drinking water, as the Gram Panchayat head. |
| 7 | Women's employment | Assess women's participation in local employment schemes. |
| 8 | Rural health and sanitation | Identify local health and sanitation issues for a project study. |
| 9 | Food adulteration | Survey the extent of food adulteration following a complaint. |
| 10 | Polio immunisation | Prepare a report on a polio immunisation programme in a particular area. |
| 11 | Savings habits | Survey people's saving habits in relation to their income and expenditure. |
| 12 | Agriculture | Study farming practices and problems faced by farmers in a village. |
- Choose a topic that addresses an economic issue.
- Project outputs may include a report, project proposal or survey, depending on the topic.
Quick recap
- Project topics can focus on transport, cottage industries, advertising and sales, and education.
- Local economic and consumer issues include overcharging, women's employment and food adulteration.
- Community projects can address village amenities, rural health, sanitation and immunisation.
- Surveys can study savings in relation to income and expenditure.
- Agricultural projects can investigate farming practices and farmers' problems.
Sample Project
Purpose and Approach
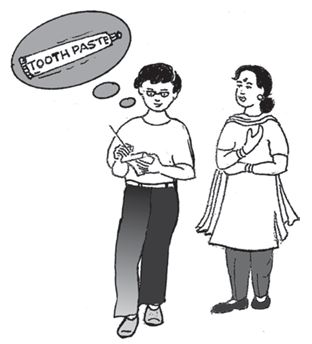
Information Needed and Questionnaire
| Study focus | Information required |
|---|---|
| Expenditure | Average monthly expenditure on toothpaste |
| Demand | Brands of toothpaste currently in demand |
| Consumer attitude | Customers’ attitudes towards those brands |
| Product preferences | Preferred toothpaste ingredients or qualities |
| Media influence | Major sources of information influencing toothpaste demand |
| Income relationship | How income relates to expenditure, brand demand, attitudes, preferences and media influences |
| Questions | Information captured |
|---|---|
| 1–7: Name, sex, ages of family members, total family size, monthly family income, urban/rural residence and main breadwinner’s occupation | Respondent and household profile; occupation choices include service, professional, manufacturer, trader or other |
| 8: Does the family use toothpaste to clean teeth? Yes/No | Establishes toothpaste use; later questions about the product are conditional on a Yes response |
| 9: Essential qualities of a good toothpaste | Respondents may select multiple options: plain, gel, antiseptic, flavoured, carries protection, fluoride or other |
| 10–12: Brand used; number of 100-gram packs used per month; satisfaction Yes/No | Captures current brand, quantity used and attitude towards the brand |
| 13–14: Willingness to try a new toothpaste Yes/No; desired features if Yes | Measures openness to a new product and its preferred qualities; multiple options may be selected |
| 15: Main sources of toothpaste information | Options: cinema, exhibitions, internet, magazines, newspapers, radio, sales representatives, television or other |
- Primary data
- Data collected directly for the study in question.
- Questionnaire
- A planned set of questions used to collect required information.
- Consumer preference
- Consumers’ choices or desired qualities for a product.
What should guide the preparation or selection of a questionnaire?
Quick recap
- A project’s data-collection method should suit its subject and purpose.
- The toothpaste-factory study can collect primary data from consumers.
- The questionnaire should cover expenditure, brands, attitudes, preferences, media influence and income relationships.
- A tested questionnaire may be adapted; a new one should ask for all required information.
- The sample questionnaire records household details, use, brand, quantity, satisfaction and response to new-product features.
Data Analysis And Interpretation
From Collected Data to a Project Report
Data analysis and interpretation — Data analysis organises and examines collected information; interpretation explains what the results mean and helps draw conclusions.
Basic survey-report details
- Sample: The example survey covered 100 households.
- Location: 67% of households were urban and 33% were rural; most surveyed users were from urban areas.
- Report: Present organised data, use suitable statistical tools, interpret patterns and state a conclusion.
Age Distribution
| Age group (years) | Number of persons |
|---|---|
| Below 10 | 74 |
| 10–20 | 56 |
| 20–30 | 91 |
| 30–40 | 146 |
| 40–50 | 93 |
| Above 50 | 40 |
| Total | 500 |
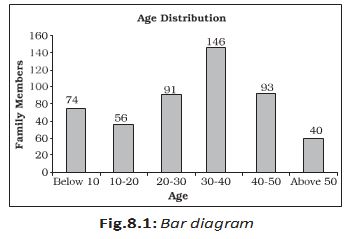
Interpretation
- Largest group: Ages 30–40 had the highest count, with 146 persons.
- Overall pattern: The table shows most persons were in the 20–50 age range.
Monthly Family Income: Frequency Distribution, Mean and Standard Deviation
| Income class (Rs.) | Midpoint | Frequency | |||
|---|---|---|---|---|---|
| 0–10,000 | 5,000 | 20 | −3 | −60 | 180 |
| 10,000–20,000 | 15,000 | 40 | −1 | −40 | 40 |
| 20,000–30,000 | 25,000 | 30 | 1 | 30 | 30 |
| 30,000–40,000 | 35,000 | 10 | 3 | 30 | 90 |
| Total | 100 | −40 | 340 |
is the assumed mean, is the class width and .
Use the same assumed mean and class width as in the mean calculation.
Income results
- Values used: , , , and .
- Mean income: .
- Standard deviation: .
Family Size
| Family size | Number of families |
|---|---|
| 1–2 | 20 |
| 3–4 | 40 |
| 5–6 | 30 |
| Above 6 | 10 |
| Total | 100 |
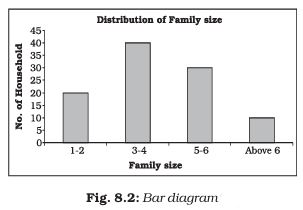
Interpretation
- Main pattern: Most surveyed families had 3–6 members: 40 families had 3–4 members and 30 had 5–6.
Monthly Family Income Status
| Income range (Rs.) | Number of households |
|---|---|
| 0–10,000 | 20 |
| 10,000–20,000 | 40 |
| 20,000–30,000 | 30 |
| 30,000–40,000 | 10 |
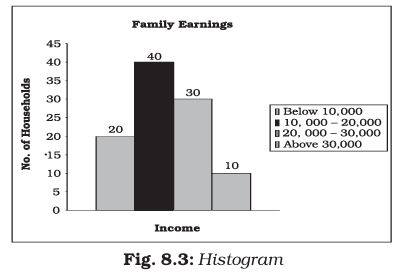
Interpretation
- Main pattern: Most families had monthly incomes between Rs. 10,000 and Rs. 30,000: 40 households were in the first range and 30 in the second.
Monthly Family Budget on Toothpaste
| Expenditure class (Rs.) | Midpoint | Frequency | |||
|---|---|---|---|---|---|
| 0–40 | 20 | 5 | −2 | −10 | 20 |
| 40–80 | 60 | 20 | −1 | −20 | 20 |
| 80–120 | 100 | 40 | 0 | 0 | 0 |
| 120–160 | 140 | 30 | 1 | 30 | 30 |
| 160–200 | 180 | 5 | 2 | 10 | 20 |
| Total | 100 | 10 | 90 |
Toothpaste expenditure results
- Mean: With , , and , mean monthly expenditure is per household.
- Reported standard deviation: The lecture states per month.
Check the totals before calculating: the toothpaste table gives , but the lecture's standard-deviation calculation uses 80. Using the table total gives ; Rs. 35.60 follows from using 80.
Major Occupational Status
| Family occupation | Number of families |
|---|---|
| Service | 30 |
| Professional | 5 |
| Manufacture | 10 |
| Trader | 40 |
| Any other | 15 |
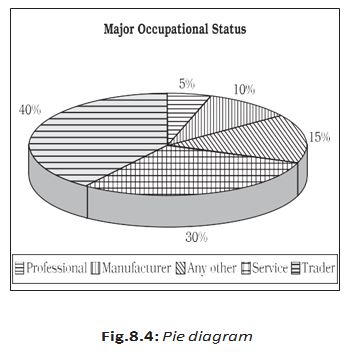
Interpretation
- Main pattern: Traders formed the largest group (40 families), followed by service households (30); together these were the most common occupations.
Preferred Toothpaste Brands
| Brand | Households | Brand | Households |
|---|---|---|---|
| Aquafresh | 5 | Anchor | 4 |
| Cibaca | 9 | Babool | 3 |
| Close-up | 12 | Promise | 3 |
| Colgate | 18 | Meswak | 5 |
| Pepsodent | 20 | OralB | 7 |
| Pearl | 4 | Sensodyne | 7 |
| Any other | 3 |
Interpretation
- Most preferred: Pepsodent (20 households), Colgate (18) and Close-up (12) were the leading brands.
Basis of Toothpaste Selection
| Feature | Family members |
|---|---|
| Advertisement | 15 |
| Persuaded by dentist | 5 |
| Price | 35 |
| Quality | 45 |
| Taste | 20 |
| Ingredients | 10 |
| Standardised marking | 50 |
| Tried new product | 10 |
| Company's brand name | 35 |
Interpretation
- Key influences: Standardised marking, quality, price and company brand name were prominent selection factors.
Taste and Preferences
| Brand | Satisfied | Unsatisfied |
|---|---|---|
| Aquafresh | 2 | 3 |
| Cibaca | 5 | 4 |
| Close-up | 10 | 2 |
| Colgate | 16 | 2 |
| Meswak | 3 | 2 |
| Pepsodent | 18 | 2 |
| Anchor | 2 | 2 |
| Babool | 2 | 1 |
| Promise | 2 | 1 |
| OralB | 4 | 3 |
| Sensodyne | 5 | 2 |
| Pearl | 2 | 2 |
Interpretation
- Overall pattern: Among the most-used toothpastes, reported dissatisfaction was relatively low compared with satisfaction.
Ingredients Preference
| Ingredient | Value |
|---|---|
| Plain | 40 |
| Gel | 70 |
| Antiseptic | 80 |
| Flavoured | 50 |
| Carries protective | 30 |
| Fluoride | 10 |
Interpretation
- Most preferred: Antiseptic-based and gel toothpastes received the highest preference values.
Media Influence
| Medium | Families influenced |
|---|---|
| Television | 47 |
| Newspaper | 30 |
| Magazine | 20 |
| Cinema | 25 |
| Sales representative | 15 |
| Exhibits/stall | 10 |
| Radio | 18 |
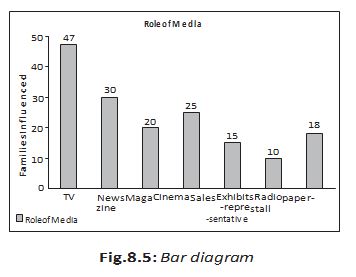
Interpretation
- Main sources: Television was the leading medium (47 families), followed by newspapers (30).
Concluding Note of the Project Report
Overall findings
- Households: Most surveyed users were urban; families commonly had 3–6 members and monthly incomes of Rs. 10,000–30,000.
- Occupation: Service and trading were the leading occupations.
- Spending: Average toothpaste expenditure was reported as Rs. 104 per household per month.
- Preferences: Pepsodent, Colgate and Close-up led in brand preference; gel and antiseptic types were most preferred.
- Advertising: Many respondents were influenced by advertisements, especially those on television.
The concluding note gives an age range of 25–50, but the age table is grouped into intervals and supports the broader 20–50 range. Use the figures shown in the relevant table when interpreting the data.
Key Steps in a Statistical Study
Survey to conclusion
- Clearly identify the study objective.
- Choose the population and sample carefully.
- Select the type of data needed to meet the objective.
- Prepare a questionnaire or interview schedule.
- Analyse collected data using suitable statistical tools.
- Interpret the results and draw meaningful conclusions.
How are the mean and standard deviation calculated by the step-deviation method?
What were the main findings about household income and toothpaste expenditure?
Quick recap
- Organise collected survey data in frequency tables and suitable diagrams.
- Use grouped-data frequencies and class midpoints to calculate mean and standard deviation.
- Interpret the main patterns rather than presenting tables alone.
- The example found mean family income of Rs. 18,000 and mean toothpaste expenditure of Rs. 104 per month.
- Most surveyed households were urban, had 3–6 members and earned Rs. 10,000–30,000 monthly.
- A clear objective, careful sample selection and suitable data analysis support meaningful conclusions.
Glossary Of Statistical Terms
Analysis, Data and Classification
Core Terms
- Analysis: Understanding and explaining an economic problem by examining its causes.
- Assumed mean: An approximate value chosen to simplify calculations.
- Attribute: A qualitative characteristic that cannot be measured numerically.
- Bimodal distribution: A distribution with two modes.
- Bivariate distribution: A frequency distribution involving two variables.
- Census method: Data collection in which observations are taken from every individual in the population.
- Chronological classification: Arranging data according to time.
- Class frequency: The number of observations in a particular class.
- Class interval: The difference between the upper and lower class limits.
- Class mark / class midpoint: The middle, representative value of a class; class mark and class midpoint mean the same thing.
- Classification: Arranging similar items into groups or classes.
- Consumer: A person who buys goods for personal or family needs, or as a gift.
- Constant: A quantity used to describe an attribute that does not change during an investigation or calculation.
- Continuous variable: A quantitative variable that can take any numerical value.
Use this to find a class's representative value; is the upper class limit and is the lower class limit.
Variables, People and Class Intervals
- Cyclicity: A recurring pattern in data with a period longer than one year.
- Decile: A value that divides data into ten equal parts.
- Discrete variable: A quantitative variable that takes specific values, changing in finite jumps; intermediate values are not taken.
- Economics: The study of how people and society use scarce resources with alternative uses to produce goods and distribute them.
- Employee: A person paid to work for another person.
- Employer: A person who pays another person to do work.
- Enumerator: A person who collects data.
- Exclusive method: A classifying method in which a class's upper limit is excluded and assigned to the next class; the lower limit is included.
- Frequency: The number of times a value occurs in raw data; in a frequency distribution, the number of observations in a class.
- Frequency array: A classification of a discrete variable showing its values and corresponding frequencies.
- Frequency curve: A graph with class marks on the -axis and class frequencies on the -axis.
- Frequency distribution: A classification showing the values or classes of a quantitative variable and their class frequencies.
- Inclusive method: A classifying method in which both the lower and upper limits are included in that class.
Data Collection and Frequency
- Informant: The individual or unit from whom information is obtained.
- Multimodal distribution: A distribution with more than two modes.
- Non-sampling error: An error in data collection caused by sampling bias, non-response or errors in data acquisition.
- Observation: A single unit of raw data.
- Percentiles: Values dividing data into 100 equal parts; there are 99 percentiles.
- Policy: A measure designed to solve an economic problem.
- Population: All individuals or units about whom information is required.
- Qualitative classification: Grouping data by quality, such as gender or marital status.
- Qualitative data: Information expressed in terms of qualities.
- Quantitative data: Systematically arranged numerical information used to understand a subject or support decisions.
- Questionnaire: A list of questions prepared by an investigator for respondents to answer.
- Random sampling: Selecting a representative set so every individual has an equal chance of being chosen.
- Range: The difference between the maximum and minimum values of a variable.
- Relative frequency: A class frequency expressed as a proportion or percentage of the total frequency.
- Sample survey method: Collecting observations from a representative sample selected from the population.
- Sampling error: The numerical difference between a sample estimate and the corresponding true population parameter.
- Scarcity: Lack of availability.
- Seasonality: A recurring pattern in data with a period shorter than one year.
- Seller: A person who sells goods for profit.
- Service provider: A person or organisation providing a service to others for payment.
- Spatial classification: Arranging data according to geographical location.
Statistical Presentation and Measures
- Statistics: The methods of collecting, organising, presenting and analysing data to draw meaningful conclusions; also refers to data itself.
- Structured questionnaire: A questionnaire containing closed-ended questions with alternative answers provided.
- Tally marking: Counting observations with tally marks, grouped in fives.
- Time-series data: Data arranged chronologically, or two-variable data in which one variable is time.
- Univariate distribution: A frequency distribution of one variable.
- Variable: A quantity used to measure an attribute, such as height, weight or number, that can take different values in different situations.
- Weighted average: An average calculated by assigning different weights to different data points.
How do the census method and sample survey method differ?
Distinguish between sampling error and non-sampling error.
Quick recap
- Classification organises similar observations into groups; it may be chronological, qualitative or spatial.
- A class midpoint is the average of its upper and lower class limits; class frequency counts observations in the class.
- A census covers the whole population, while a sample survey observes a representative subset.
- Random sampling gives every individual an equal chance of selection.
- Sampling error compares a sample estimate with the true population value; non-sampling error comes from data-collection problems.
- A frequency distribution shows how quantitative values are spread across classes; a frequency array lists discrete values and their frequencies.
Economics — ALL CHAPTERS
1
Introduction
2
Theory of Consumer Behaviour
3
Production And Costs
4
The Theory Of The Firm Under Perfect Competition
5
Market Equilibrium
1
Introduction
2
Collection of Data
3
Organizing of Data
4
Presentation of Data
5
Measures of Central Tendency
6
Correlation
7
Index Numbers
8
Use of Statistical Tools