Class 12 Humanities . Sociology . Indian Society . The Demographic Structure of the Indian Society
Chapter 2: THE DEMOGRAPHIC STRUCTURE OF THE INDIAN SOCIETY
Ch 2
Sociology
Class 12 Humanities
INTRODUCTION & Some Theories and Concepts in Demography
Demography and Its Scope
- Meaning: Demography is the systematic study of population, including its size, composition and change.
- Scope: It examines births, deaths, migration and population structure using data gathered through censuses and surveys.
Demography, the State, and Sociology
| Point | Individual event | Aggregate pattern |
|---|---|---|
| Example | A particular person’s death or suicide. | A death or suicide rate across a population. |
| Explanation | May involve circumstances specific to that individual. | Requires explanation through broader social causes and conditions. |
Census and the Growth of State Data Collection
- Modern census: The American census of 1790 was probably the first modern census; European countries adopted the practice in the early 1800s.
- Indian census: The British Indian government conducted censuses between 1867 and 1872; regular decennial censuses began in 1881.
- After independence: India continued decennial censuses from 1951; the text identifies 2011 as the most recent census.
- Scale: The Indian census is described as the world’s largest, as China does not conduct regular censuses.
Key Developments in Population Data
- Latter half of the 18th centuryEuropean nation-states expanded their activities as modern statistics began to develop.
- 1790The American census was probably the first modern census.
- Early 1800sCensus-taking spread to Europe.
- 1867–1872The British Indian government conducted censuses.
- 1881 onwardRegular decennial censuses began in India.
- 1951 onwardIndependent India continued the decennial census; the text names 2011 as the most recent.
Durkheim and Social Causes
- Émile Durkheim: Used differences in suicide rates across countries to show how a population pattern can be explained socially.
- Key idea: Individual suicides may have particular personal circumstances, but differences in suicide rates require social-level explanation.
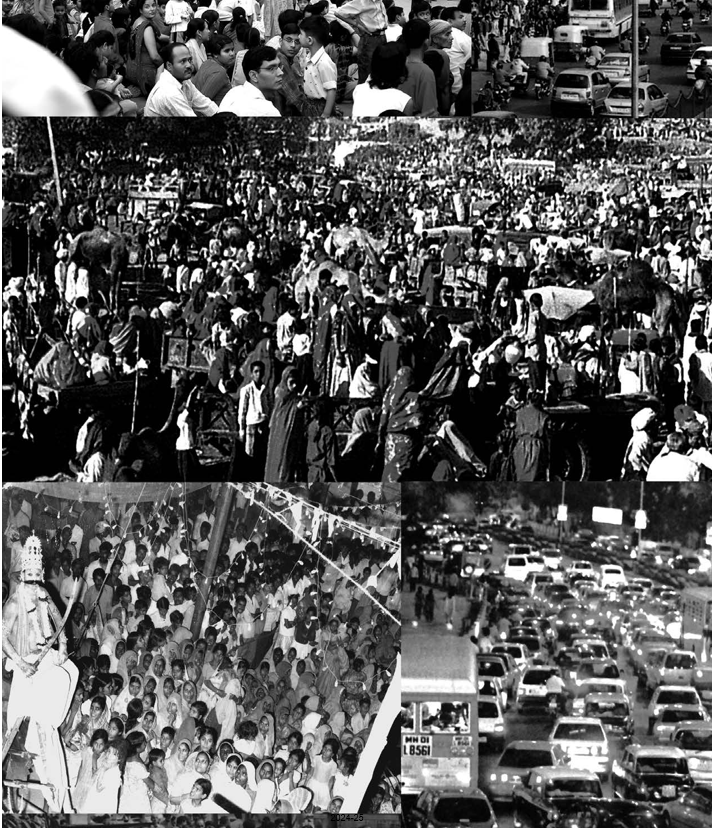
| Point | Formal demography | Social demography / population studies |
|---|---|---|
| Main concern | Measurement and analysis of population-change components. | Wider causes and consequences of population structures and change. |
| Approach | Quantitative, with mathematical methods. | Explains how social processes and structures shape demographic patterns. |
| Use | Can forecast population growth and changes in composition. | Connects population trends to social, economic, and political conditions. |
The Malthusian Theory of Population Growth
Malthus’s Argument
- Population grows geometrically.
- Food and other subsistence resources grow more slowly, in arithmetic progression.
- Population exceeds available subsistence.
- Poverty and population checks, especially famine and disease, follow.
Challenges to Malthus
- Economic growth: Critics argued that economic growth could outpace population growth.
- European experience: From the latter half of the 19th century, birth rates declined and epidemic diseases came under control; by the end of the first quarter of the 20th century, these changes were dramatic.
- Rising living standards: Food production and standards of living continued to rise despite rapid population growth, contradicting Malthus’s predictions.
- Liberal and Marxist criticism: Poverty and starvation were attributed to unequal distribution of resources and an unjust social system, not simply to population growth.
The Theory of Demographic Transition
Why the Transitional Stage Produces Rapid Growth
- Disease control, public health, and improved nutrition reduce death rates quickly.
- Birth rates take longer to fall because reproductive behaviour adjusts more slowly.
- More people survive while births remain high.
- The population grows rapidly until birth rates decline.
Transition in Europe and India
- Western Europe: The transition took place during the late 19th and early 20th centuries.
- Less developed countries: Similar patterns occur as societies try to reduce birth rates after mortality falls.
- India: The transition is incomplete: mortality has fallen, but the birth rate has not declined to the same extent.
Distinguish formal demography from social demography.
What were Malthus’s preventive and positive checks?
Why does population growth become very high in the transitional stage?
- Aggregate statistics
- Numerical data describing a large collectivity, such as a country’s population.
- Decennial census
- A census conducted every ten years.
- Preventive checks
- Voluntary restraints intended to slow population growth in Malthus’s theory.
- Positive checks
- Events such as famine and disease that increase mortality in Malthus’s theory.
- Population explosion
- Very rapid growth during the transitional stage when death rates fall before birth rates.
Quick recap
- Demography studies population size, composition, and change using systematic data collection.
- Formal demography measures population trends; social demography explains their wider social causes and effects.
- Census and aggregate statistics help governments plan and show that social patterns require social explanations.
- Malthus predicted population would outgrow subsistence, but rising production and unequal resource distribution challenged his explanation of poverty.
- The demographic transition moves from low growth to rapid growth and then back to low growth as birth and death rates decline.
- India’s transition remains incomplete because mortality has fallen more than the birth rate.
Common Concepts and Indicators
Rates and Ratios
is the number of live births and is the population.
is the number of deaths and is the population.
Population Growth and Replacement
is the birth rate and is the death rate.
Fertility and Mortality
is the number of women in the child-bearing age group.
| Indicator | Definition | What it indicates |
|---|---|---|
| Infant mortality rate | Deaths of babies before age one per 1,000 live births. | High rates indicate poverty and limited development; they fall with improved medical care, education, awareness and prosperity. |
| Maternal mortality rate | Women who die in childbirth per 100,000 live births. | High rates indicate poverty and limited development; they fall as health and living conditions improve. |
| Life expectancy | The estimated number of years an average person is expected to live. | Calculated using age-specific death-rate data for an area over a period of time. |
Sex Ratio
is the number of females and is the number of males.
Age Structure and Population Ageing
- Age structure: The proportions of people in different age groups relative to the total population.
- Changing pattern: Development and longer life expectancy tend to reduce the share of children and increase the share of older people.
Dependency Ratio and Demographic Dividend
is the population below age , is the population above age , and is the working-age population.
- Crude rate
- A rough population-wide average that does not account for differences between age groups.
- Age-specific rate
- A rate calculated for a particular age group.
- Replacement level
- The rate of growth required for new generations to replace those dying out.
- Population ageing
- A shift towards a larger proportion of people in older age groups.
- Demographic dividend
- The potential benefit when working-age people make up a larger share of the population.
What is the difference between a crude fertility rate and an age-specific rate?
Why is the demographic dividend temporary?
Quick recap
- Birth and death rates express births or deaths per 1,000 population; the natural increase is the difference between them.
- A stable population has a zero or very small natural increase; negative growth occurs when fertility is below replacement level.
- Fertility rates use women of child-bearing age, while age-specific rates account for variation between age groups.
- Infant and maternal mortality measure deaths around infancy and childbirth; life expectancy uses age-specific death rates.
- Sex ratio is females per 1,000 males; son preference and neglect of girls are linked to declines in some countries.
- Development can raise life expectancy and increase the proportion of older people, changing the age structure.
- A lower dependency ratio may create a temporary demographic dividend; a higher ratio can burden workers.
Size and Growth of India’s Population
Population size and growth over time
- Population: India had 121 crore people in 2011, making it the world’s second most populous country after China.
- Growth pattern: Growth was modest from 1901 to 1951, rose substantially after Independence, and has slowed in recent decades.
Birth and death rates: demographic transition
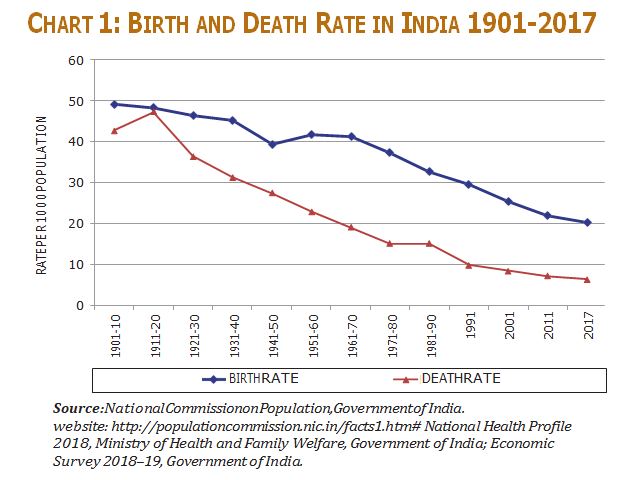
Why death rates declined
Pandemic — An epidemic that affects a very wide geographical area.
Influenza pandemic of 1918–19
- Spanish Flu: A global influenza pandemic; estimates suggest it killed about 17 million people in India, roughly 5% of the population at the time.
- Global impact: At least 40 million deaths worldwide are estimated; the pandemic affected about 20% of the world’s population to some extent.
- Spread: Influenza viruses change genetically, which can reduce the effectiveness of existing vaccines. Troop movements and close living conditions during World War I accelerated the flu’s spread.
- Other influenza pandemics: Major outbreaks also occurred in 1957 (Asian influenza) and 1968 (Hong Kong influenza).
Famine, food access and mortality
- Causes: Famines were linked to poverty, malnutrition, rainfall vulnerability, poor transport and inadequate state relief.
- Food access: Famines can result from a failure of people’s entitlements to obtain food, even when food production has not fallen.
- Mortality decline: Better irrigation, communication and state relief have reduced famine deaths, though starvation deaths still occur in some regions.
Birth rates and fertility differences
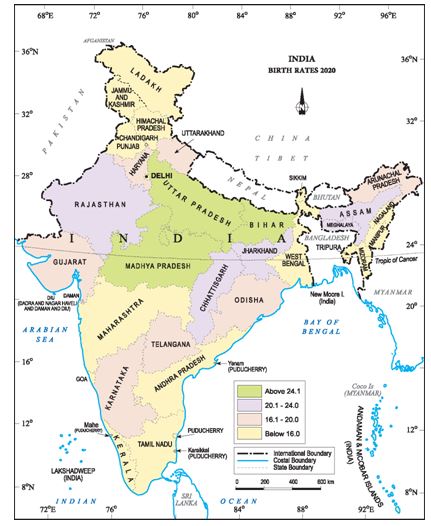
| Area | Crude birth rate |
|---|---|
| India | 19.5 |
| Rural India | 21.1 |
| Urban India | 16.1 |
| Bihar | 25.5 |
| Uttar Pradesh | 25.1 |
Projected contribution to population growth
- Bihar and Uttar Pradesh: Together, they were projected to account for about 50% of India’s population additions up to 2041.
- Uttar Pradesh: Alone, it was projected to contribute 22%—a little less than one-quarter—of the increase.
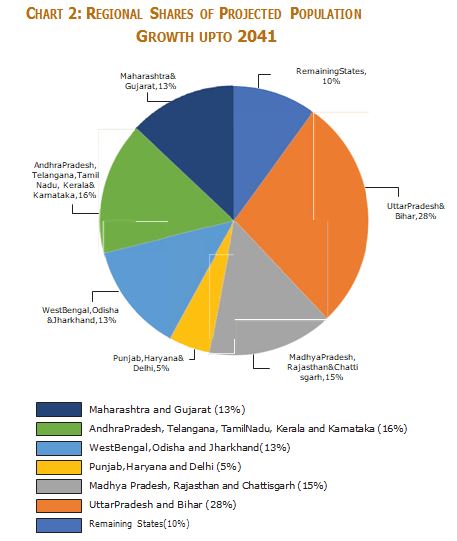
What is meant by a failure of entitlements in the context of famine?
Why have birth rates generally fallen more slowly than death rates?
What were the key population-growth projections for Bihar and Uttar Pradesh up to 2041?
Quick recap
- India had 1.21 billion people in the 2011 Census; population growth peaked near 2.2% annually during 1961–1981.
- The 1918–19 influenza pandemic contributed to negative growth in 1911–1921 and killed about 5% of India’s population.
- Death rates fell through stronger control of epidemics and famines; medical care, vaccination and sanitation also helped.
- Famine may result from failure of entitlements, not only reduced food production; irrigation, communication and state relief lowered famine deaths.
- Birth rates change slowly; prosperity, lower infant mortality, education and awareness encourage smaller families.
- TFR and birth rates vary across states; Bihar and Uttar Pradesh were projected to drive about half of population additions up to 2041.
Age Structure of the Indian Population
India’s Age Composition
| Year | 0–14 years | 15–59 years | 60+ years |
|---|---|---|---|
| 1961 | 41 | 53 | 6 |
| 1971 | 42 | 53 | 5 |
| 1981 | 40 | 54 | 6 |
| 1991 | 38 | 56 | 7 |
| 2001 | 34 | 59 | 7 |
| 2011 | 29 | 63 | 8 |
| 2026 (projected) | 23 | 64 | 12 |
Key changes
- 1971–2011: The under-15 share fell from 42% to 29%; the 15–59 share rose from 53% to 63%. The table shows the 60+ share increasing from 5% to 8%.
- 2001–2026 projection: The 0–14 share is expected to fall from 34% to 23%, while the 60+ share is expected to rise from 7% to 12%.
- Note: The age-group shares may not add to exactly 100 because of rounding.
Reading Population Pyramids
What a population pyramid shows
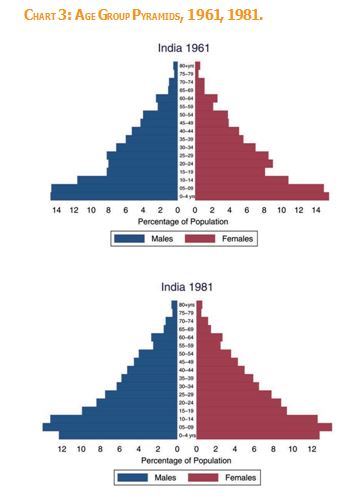
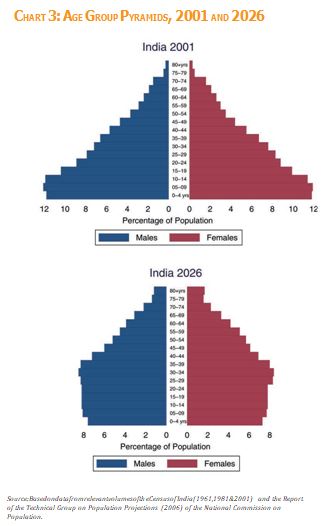
- Layout: Five-year age groups run from 0–4 at the base to 80+ at the top; males are shown on the left and females on the right.
- Bars: The combined width of both sides at an age group shows that group’s share of the population.
- Projections: The 2026 pyramid is an estimate based on past growth rates of each age group.
How the pyramid changes
- Fewer births over time → a narrower base.
- Rising life expectancy → more people reach older ages, widening the top.
- A rising share of people in middle age groups → a wider middle, or a demographic bulge.
Following a generation
- Example: The 0–4 age group in 1961 moves to 20–24 in 1981, 40–44 in 2001 and about 65–69 in 2026.
- Demographic bulge: By 2026, the middle age groups are especially wide as a share of the total population.
Regional Differences in Age Structure
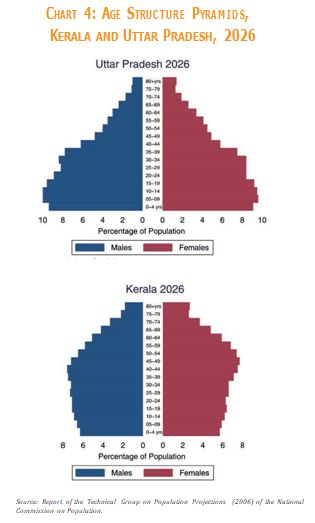
| Point | Kerala | Uttar Pradesh |
|---|---|---|
| Age pattern | More like the age structure of developed countries, with a relatively older population. | Higher proportions in younger age groups and relatively fewer older people. |
| Pyramid’s widest part | Located among older age groups compared with Uttar Pradesh. | Located among younger age groups compared with Kerala. |
Demographic Dividend
India’s young population
- 2011: About one-third of India’s population was below 15 years of age.
- Average age in 2020: India 29; China and the United States 37; Western Europe 45; Japan 48.
- Implication: A relatively young population can mean a large and growing labour force, with potential benefits for prosperity.
Working-age population — For the dependency-ratio discussion, the working-age population is roughly people aged 15–64.
Age-based dependency ratio — The ratio of the non-working-age population (children and elderly people) to the working-age population.
| Point | Age-based ratio | Actual work status |
|---|---|---|
| What it compares | People outside working age with people of working age. | Non-workers with workers. |
| Why the figures can differ | Classifies people by age, not whether they have jobs. | Unemployment and underemployment can leave working-age people without productive work. |
Age-based dependency ratio in India
- 1970Total age-based dependency ratio was 79.
- 2005The ratio had fallen to 64.
- 2025 (projected)The ratio was projected to fall further to 48, mainly as the proportion of children declines.
- 2050 (projected)The ratio was projected to rise to 50 as the proportion of elderly people increases.
Turning Potential into Growth
Conditions for gaining the dividend
- More people enter working age → education and skills raise their productivity.
- Productive employment provides earnings → working-age people contribute as earners rather than becoming dependents.
- Education and job creation are missing or inadequate → the demographic advantage is not converted into growth.
Employment growth among young men
- 1987–1994Employment growth among 15–30-year-old rural and urban men was about 2.4% a year.
- 1994–2004It fell to 0.7% a year for rural men and 0.3% for urban men.
Policy implication
- Challenge: Employment generation fell sharply, including for young people, limiting the gains from a growing labour force.
- Response needed: Education, productive jobs and planned development are needed; market forces alone do not ensure these strategies are implemented.
What is the demographic dividend, and why is it not automatic?
How is the age-based dependency ratio changing in India?
- Population pyramid
- A graph showing population shares by age group and sex.
- Projection
- An estimate of future population based on trends such as past age-group growth.
- Demographic dividend
- Potential economic gain from a relatively large working-age population.
- Dependency ratio
- A comparison of dependents with the working-age population, or in actual-work terms, non-workers with workers.
Quick recap
- India’s population is relatively young, but the share of children is declining and the share of older people is rising.
- The 2026 projection shows a smaller 0–14 share and a larger 60+ share than in 2001; the working-age share grows slightly.
- Population pyramids show age groups by sex; falling birth rates narrow the base, while rising life expectancy widens the top.
- Kerala has a relatively older age pattern than Uttar Pradesh, which has a larger share of young people.
- The age-based dependency ratio fell from 79 in 1970 to 64 in 2005, was projected to reach 48 in 2025, then rise to 50 in 2050.
- Education and productive employment are necessary to turn the demographic opportunity into economic growth; employment growth among young men declined substantially.
The Declining Sex-ratio in India
Meaning and National Trends
Sex ratio — The number of females per 1,000 males; it is an important indicator of gender balance in a population.
Overall sex ratio
- Historical pattern: The sex ratio has generally been slightly in favour of females, with more than 1,000 females per 1,000 males.
- Long-term trend: India’s overall sex ratio fell from 972 in 1901 to 933 in 2001, then rose to 943 in the 2011 Census.
- Recent trend: It dropped from 941 in 1961 to a low of 927 in 1991, before increasing by 6 points in 2001 and 10 points in 2011.
| Year | Sex ratio: all ages | Change | Child sex ratio: ages 0–6 | Change |
|---|---|---|---|---|
| 1901 | 972 | — | — | — |
| 1911 | 964 | −8 | — | — |
| 1921 | 955 | −9 | — | — |
| 1931 | 950 | −5 | — | — |
| 1941 | 945 | −5 | — | — |
| 1951 | 946 | +1 | — | — |
| 1961 | 941 | −5 | 976 | — |
| 1971 | 930 | −11 | 964 | −12 |
| 1981 | 934 | +4 | 962 | −2 |
| 1991 | 927 | −7 | 945 | −17 |
| 2001 | 933 | +6 | 927 | −18 |
| 2011 | 943 | +10 | 919 | −8 |
The Child Sex Ratio
Child sex ratio — The number of girls per 1,000 boys aged 0–6 years; also called the juvenile sex ratio.
Why the child sex ratio is concerning
- Age-specific data: Child sex ratios began to be calculated in 1961; figures before then are unavailable.
- Sharp decline: The child sex ratio fell from 976 in 1961 to 919 in 2011, a sharper drop than the overall sex ratio.
- 1991–2001 anomaly: The overall ratio rose by 6 points, but the child ratio fell by 18 points—from 945 to 927—and became lower than the overall ratio for the first time.
- 2001–2011: The table’s figures show a fall from 927 to 919, a decrease of 8 points.
The prose states a 13-point fall in 2011, but the table lists 927 in 2001 and 919 in 2011; these figures imply an 8-point fall. The notes use the table values.
Regional Differences in Child Sex Ratios
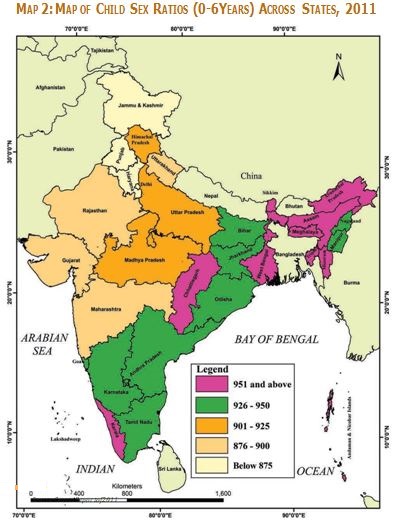
- Below 900: Nine States and Union Territories had fewer than 900 females per 1,000 males.
- Lowest: Haryana had the lowest ratio at 793 and was the only state below 800. Punjab, Jammu and Kashmir, Delhi, Chandigarh, Uttarakhand and Himachal Pradesh were also among the very low-ratio regions.
- Below 925: Uttar Pradesh, Daman and Diu, Himachal Pradesh, Lakshadweep and Madhya Pradesh were reported below 925.
- Above the national average: West Bengal, Assam, Bihar, Tamil Nadu, Andhra Pradesh and Karnataka were above 919 but below 970.
- Other figures: Kerala’s child ratio was 964; Arunachal Pradesh had the highest, at 972.
Reasons for the Declining Sex Ratio
| Factor | What the text indicates |
|---|---|
| Maternal mortality | Childbirth exposes women to death risk. However, maternal mortality has declined with improvements in nutrition, education, awareness and medical and communication facilities, so it does not explain the worsening trend well. |
| Differential treatment of girls | The much steeper fall in the child sex ratio points to unequal treatment of girl babies as a key explanation. |
Discrimination Against Girl Children
| Factor | How it lowers the ratio |
|---|---|
| Neglect of girl babies | Severe neglect in infancy increases girls’ risk of death. |
| Sex-selective abortion | Identifying and aborting female foetuses prevents girls from being born. |
| Female infanticide | The killing of girl babies after birth, sometimes associated with religious or cultural beliefs. |
Misuse of ultrasound technology
- Original use: Sonograms use ultrasound technology to help identify genetic or other disorders in a foetus.
- Misuse: The technology can be used to identify foetal sex and selectively abort female foetuses.
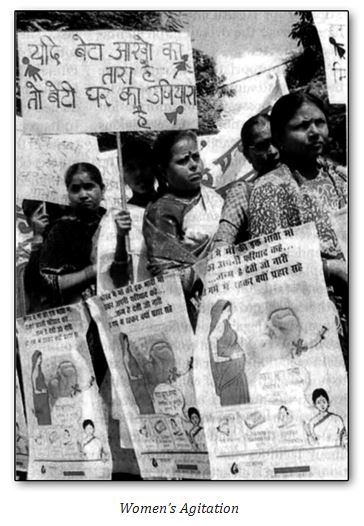
Prosperity, Law and Social Change
- Prosperous regions: Maharashtra, Punjab, Haryana, Chandigarh and Delhi combine high per-capita incomes with low child sex ratios.
- Implication: Selective abortion cannot be explained simply by poverty, ignorance or a lack of resources.
- Family choices: Some prosperous families choose to have only one or two children and may also wish to choose the child’s sex; ultrasound can make this possible.
- Prenatal Diagnostic Techniques (Regulation and Prevention of Misuse) Act: In force since 1996, it bans misuse of prenatal diagnostic techniques for sex selection and provides for heavy fines and imprisonment; it was strengthened in 2003.
- Beti Bachao, Beti Padhao: The Government of India programme can help improve the child sex ratio.
- Long-term solution: Laws and programmes can help, but lasting change depends greatly on evolving social attitudes towards girls.
- Sex ratio
- Females per 1,000 males in a population.
- Child sex ratio
- Girls per 1,000 boys among children aged 0–6 years.
- Female infanticide
- The killing of girl babies.
- Sex-selective abortion
- Abortion selected on the basis of the foetus’s sex.
- Son preference
- A social preference for sons over daughters.
What is the child sex ratio, and how did it change from 1991 to 2001?
Name three factors that can lower the child sex ratio.
When did the Prenatal Diagnostic Techniques Act come into force, and when was it strengthened?
Quick recap
- Sex ratio means females per 1,000 males; India’s overall ratio was 943 in 2011.
- The child sex ratio was 919 in 2011 and declined more sharply than the overall ratio.
- The table shows a child sex-ratio fall from 927 in 2001 to 919 in 2011, or 8 points.
- Haryana had the lowest reported child sex ratio at 793; Arunachal Pradesh had the highest at 972.
- Neglect, sex-selective abortion and female infanticide are key causes of the declining child sex ratio.
- Low ratios in prosperous regions show that poverty alone does not explain the problem; laws and evolving social attitudes are both important.
Literacy & Rural-Urban Differences
Literacy
| Year | Persons | Males | Females | Male–female gap |
|---|---|---|---|---|
| 1951 | 18.3 | 27.2 | 8.9 | 18.3 |
| 1961 | 28.3 | 40.4 | 15.4 | 25.1 |
| 1971 | 34.5 | 46.0 | 22.0 | 24.0 |
| 1981 | 43.6 | 56.4 | 29.8 | 26.6 |
| 1991 | 52.2 | 64.1 | 39.3 | 24.8 |
| 2001 | 65.4 | 75.9 | 54.2 | 21.7 |
| 2011 | 73.0 | 80.9 | 64.6 | 16.3 |
Unequal literacy
- Gender: In 2011, female literacy was 16.3 percentage points below male literacy. From 2001 to 2011, female literacy rose faster: by 10.4 points, compared with 5 points for males.
- Social groups: Scheduled Castes and Scheduled Tribes have lower literacy rates; women within these groups face further disadvantage.
- Regional differences: Kerala approaches universal literacy, while Bihar has lagged far behind.
- Across generations: Low literacy among parents can hinder their children’s education, reproducing existing inequalities.
Rural–Urban Differences
| Year | Rural population | Urban population | Rural share | Urban share |
|---|---|---|---|---|
| 1901 | 213 | 26 | 89.2 | 10.8 |
| 1911 | 226 | 26 | 89.7 | 10.3 |
| 1921 | 223 | 28 | 88.8 | 11.2 |
| 1931 | 246 | 33 | 88.0 | 12.0 |
| 1941 | 275 | 44 | 86.1 | 13.9 |
| 1951 | 299 | 62 | 82.7 | 17.3 |
| 1961 | 360 | 79 | 82.0 | 18.0 |
| 1971 | 439 | 109 | 80.1 | 19.9 |
| 1981 | 524 | 159 | 76.7 | 23.3 |
| 1991 | 629 | 218 | 74.3 | 25.7 |
| 2001 | 743 | 286 | 72.2 | 27.8 |
| 2011 | 833 | 377 | 68.8 | 31.2 |
Changing rural livelihoods and connections
- Economic shift: Agriculture, once the largest contributor to the economy, now contributes about one-sixth of GDP, despite supporting many rural residents.
- Changing work: Rural residents increasingly work in non-farm occupations such as transport, business and craft production; some commute to nearby urban centres.
- Media and markets: Mass communication brings urban lifestyles and consumption patterns into villages, creating new aspirations and linking rural areas more closely to consumer markets.
- Rural–urban link: Mass transit and communication help bridge the gap, but rural and urban areas remain economically and socially distinct.
Why rural residents migrate to cities
- Limited or insufficient rural employment and income opportunities
- Decline or loss of common property resources, such as ponds, forests and grazing lands
- Poorer households lose access to resources that once provided fuel, fodder, fish or supplementary food
- Greater hardship and need for cash income
- Migration to cities in search of work and a livelihood
Social attractions of cities
- Anonymity: Interaction with strangers can offer some protection from caste-based humiliation experienced in villages.
- Work and status: Anonymity can also let poorer members of socially dominant rural groups take low-status jobs they might avoid in their village.
- Migration pattern: Cities attract people from villages and smaller towns; this movement has contributed to rapid post-Independence urbanisation.
Metropolises and urban growth
- Largest cities: Metropolises have grown especially quickly, attracting migrants from rural areas and small towns.
- Concentration: The text reports 5,161 towns and cities and 286 million urban residents; more than two-thirds of the urban population lived in 27 cities with populations above one million.
- Infrastructure pressure: Rapid growth in large cities can outpace the development of urban infrastructure.
- Public image and power: Media focus makes India appear increasingly urban, but rural areas remain a decisive force in the country’s political power dynamics.
- Common property resources
- Shared resources such as ponds, forests and grazing lands that rural people may depend on for their livelihoods.
- Rural-to-urban migration
- Movement from rural areas to towns or cities, often to seek work or better opportunities.
- Metropolis
- A large city that attracts migrants and concentrates urban population and activity.
How can differences in literacy reproduce inequality across generations?
Give two reasons for rural-to-urban migration discussed in the lecture.
Quick recap
- Literacy empowers people, but access differs by gender, social group and region.
- In 2011, literacy was 73.0% overall; the male–female gap was 16.3 percentage points.
- India remains mainly rural, but the urban population share rose from 10.8% in 1901 to 31.2% in 2011.
- Rural livelihoods are diversifying beyond agriculture, while media and transport connect villages more closely to cities and markets.
- Limited work and declining common resources push some rural residents to cities; urban anonymity can also be an attraction.
- Metropolises grow rapidly and face infrastructure pressure, while rural areas remain politically significant.
Population Policy in India
India’s Population Policy and Its Aims
- Beginning: India announced an official population policy in 1952, among the first countries to do so.
- Programme: The National Family Planning Programme sought to guide population growth through birth control, better public health and public awareness.
Demographic Change and Population Momentum
- Demographic change: India’s fertility and population growth rates have declined, with population growth slowing since 1991.
- Population momentum: A large cohort of women of reproductive age can sustain population growth for a generation, even as each woman has fewer children.
The Emergency-Era Sterilisation Drive
- Emergency policy: During the 1975–76 National Emergency, the government pursued a coercive mass sterilisation programme to reduce population growth.
- Coercion and reaction: Many poor and powerless people were forcibly sterilised, prompting widespread opposition; the succeeding government abandoned the programme.
From Family Planning to Family Welfare
- Renaming: After the Emergency, the National Family Planning Programme became the National Family Welfare Programme, and coercive methods were discontinued.
- Broader approach: The programme adopted wider socio-demographic objectives; lasting demographic change depends on economic, social and cultural change as well as state action.
Important Goals of the National Health Policy 2017
Limits of Government Population Policy
- Government policy can help create conditions for demographic change.
- Fertility and other demographic variables are shaped by people’s circumstances and choices.
- These variables ultimately depend substantially on economic, social, and cultural change.
Quick recap
- India announced an official population policy in 1952 through the National Family Planning Programme.
- Fertility declined, but population momentum can sustain growth; the text projected 1.6 billion people by 2050.
- Emergency-era mass sterilisation used coercion, including vasectomy and tubectomy, and was abandoned after widespread opposition.
- The National Family Welfare Programme shifted away from coercion towards broader socio-demographic goals.
- The 2017 policy set specific targets for fertility, mortality, health services, disease control, and social conditions.
- Government action can support demographic change, but economic, social, and cultural change also shapes population outcomes.
Sociology — ALL CHAPTERS
1
INTRODUCING INDIAN SOCIETY
2
THE DEMOGRAPHIC STRUCTURE OF THE INDIAN SOCIETY
3
SOCIAL INSTITUTIONS CONTINUITY AND CHANGE
4
THE MARKET AS SOCIAL INSTITUTIONS
5
PATTERNS OF SOCIAL INEQUALITY AND EXCLUSION
6
THE CHALLENGES OF CULTURAL DIVERSITY
7
SUGGESTIONS FOR PROJECT WORK
1
Structural Change
2
Cultural Change
3
The Constitution and Social Change
4
Change and Development in Rural Society
5
Patterns of Industrialisation and Urbanisation
6
Globalisation and Social Change
7
Mass Media and Communications
8
Social Movements