Class 12 Humanities . Geography . Fundamentals Of Human Geography . The World Population Distribution Density and Growth
Chapter 2: The World Population Distribution, Density And Growth
Ch 2
Geography
Class 12 Humanities
Patterns Of Population Distribution In The World
Population Distribution: Meaning and Pattern in the World
Population distribution — The way people are spaced over the Earth’s surface.
Global pattern
- Uneven distribution: People are concentrated in some regions, while large areas have few inhabitants.
- Land concentration: About 90% of the world’s population lives on roughly 10% of its land area.
- Why it matters: Distribution and density patterns help describe the demographic characteristics of an area.
Population Concentration Across Countries
Most populous countries
- Population share: The 10 most populous countries together account for about 60% of the world’s population.
- Asian concentration: Six of these 10 countries are in Asia: China, India, Indonesia, Pakistan, Bangladesh and Japan.
- Early 21st century: The world’s population exceeded 6 billion.
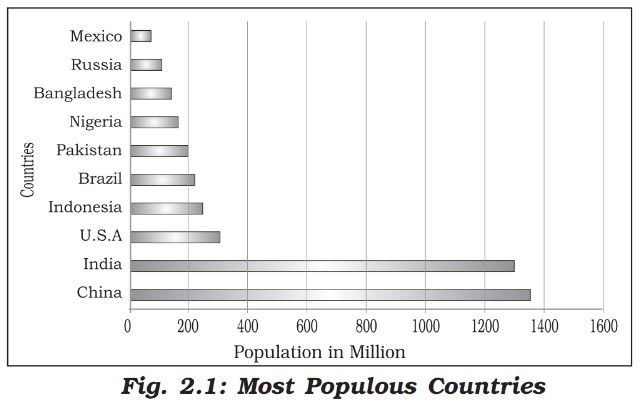
What does population distribution mean, and how is the world’s population distributed?
How significant are the 10 most populous countries, and how many are in Asia?
Quick recap
- Population distribution describes how people are spaced over the Earth’s surface.
- The world’s population is unevenly distributed.
- About 90% of people live on around 10% of the world’s land area.
- The 10 most populous countries account for about 60% of the global population.
- Six of those 10 countries are in Asia.
- At the beginning of the 21st century, world population exceeded 6 billion.
Density Of Population
Population Density
Use population and land area in consistent units.
Example
- Region X: Population = 150,000; area = 100 square kilometres.
- Calculation: persons per square kilometre.
Factors Influencing the Distribution of Population
- Influence: Population is unevenly distributed because the suitability of places for human settlement varies.
- Main groups: Factors affecting distribution are geographical, economic, social and cultural.
Geographical Factors
| Factor | Influence on population distribution | Examples |
|---|---|---|
| Water | Fresh water supports drinking, household needs, cattle, crops, industry and navigation; settlements favour accessible water. | River valleys are among the world's most densely populated areas. |
| Landforms | Flat plains and gentle slopes favour farming, roads and industries. Mountains and hills hinder transport and development. | The Ganga plains are densely populated; Himalayan mountain zones are sparsely populated. |
| Climate | Comfortable climates with little seasonal variation attract people; harsh extremes, very heavy rainfall and hot or cold deserts discourage settlement. | Mediterranean regions attracted settlement from early historical periods because of their pleasant climate. |
| Soils | Fertile loamy soils support intensive agriculture and allied activities, allowing larger populations. | Poor soils tend to be associated with thinly populated areas. |
Economic Factors
| Factor | Influence on population distribution | Examples |
|---|---|---|
| Minerals | Mineral deposits attract mining and industries, creating jobs that draw skilled and semi-skilled workers. | The Katanga-Zambia copper belt in Africa. |
| Urbanisation | Cities offer jobs, education, medical care, transport, communication and civic amenities. Rural-to-urban migration increases city size. | Mega cities continue to attract large numbers of migrants. |
| Industrialisation | Industrial belts create jobs for factory workers and service providers, including transport operators, shopkeepers, bank employees, doctors and teachers. | The Kobe-Osaka region of Japan is densely populated because of its industries. |
Social and Cultural Factors
How social and cultural factors affect settlement
- Attractions: Places of religious or cultural significance draw people.
- Push factors: People may move away from areas experiencing social or political unrest.
- Government action: Governments may offer incentives to encourage settlement in sparsely populated areas or relocation from overcrowded places.
Quick recap
- Population density is population divided by land area, usually expressed in persons per square kilometre.
- Region X has a density of 1,500 persons per square kilometre.
- Population distribution is influenced by geographical, economic, and social and cultural factors.
- Water, plains, comfortable climates and fertile soils generally support higher population densities.
- Mineral resources, urban facilities and industries attract workers and migrants.
- Cultural or religious significance can attract people, while unrest may encourage out-migration.
Population Growth
Meaning and Measurement of Population Growth
Example of Absolute Growth
- India: Population rose from crore in 2001 to crore in 2011.
- Calculation: The difference is crore. The lecture text states crore, but that figure does not match the subtraction.
Basic Concepts of Population Growth
Population change caused by the difference between births and deaths in a region over a period.
Population change after accounting for births, deaths, and migration.
| Point | Positive growth | Negative growth |
|---|---|---|
| Meaning | Population increases between two points in time. | Population decreases between two points in time. |
| Causes | Birth rate exceeds death rate, or people permanently migrate into the region from other countries. | Birth rate falls below death rate, or people migrate from the region to other countries. |
Components of Population Change
| Component | Effect on population |
|---|---|
| Births | Add people to a population. |
| Deaths | Remove people from a population. |
| Migration | Changes population through people moving into or out of an area. |
Crude Birth Rate (CBR) — Live births in a year per 1,000 people in the estimated mid-year population.
is live births during the year; is the estimated mid-year population.
Crude Death Rate (CDR) — Deaths in a particular year per 1,000 people in the estimated mid-year population; it is a simple measure of mortality.
is the number of deaths; is the estimated mid-year population.
Factors Affecting Mortality
- Mortality rates are influenced by a region’s demographic structure, social advancement, and level of economic development.
- Population growth can result from rising birth rates or from a fall in death rates.
Migration
Migration — Movement of people from one place to another, changing the population size of both places.
Migration: Key Ideas
- Place of origin: Where migrants move from; its population decreases.
- Place of destination: Where migrants move to; its population increases.
- Purpose: Migration may be understood as an effort to achieve a better balance between population and resources.
- Types by duration: Migration may be permanent, temporary, or seasonal.
| Stream | Movement |
|---|---|
| Rural to rural | From one rural area to another |
| Rural to urban | From a rural area to a town or city |
| Urban to urban | From one town or city to another |
| Urban to rural | From a town or city to a rural area |
| Point | Immigration | Emigration |
|---|---|---|
| Movement | Moving into a new place | Moving out of a place |
| Population effect | Increases population at the destination | Decreases population at the place of origin |
| Perspective | A migrant is an immigrant from the destination’s perspective. | The same migrant is an emigrant from the origin’s perspective. |
| Point | Push factors | Pull factors |
|---|---|---|
| Effect | Make the place of origin less attractive. | Make the destination more attractive. |
| Examples | Unemployment, poor living conditions, political turmoil, unpleasant climate, natural disasters, epidemics, and socio-economic backwardness. | Better job opportunities and living conditions, peace and stability, security of life and property, and pleasant climate. |
Push Away, Pull Toward
Push factors drive people away from the origin; pull factors attract them to a destination.
Population Increase
- Past 500 yearsHuman population increased more than tenfold.
- Twentieth centuryHuman population increased fourfold.
- Natural growth
- Population change due only to the difference between births and deaths.
- Actual growth
- Population change including births, deaths, immigration, and emigration.
- Immigrant
- A person who moves into a place.
- Emigrant
- A person who moves out of a place.
Distinguish natural growth from actual growth of population.
What are push and pull factors? Give examples.
Quick recap
- Population growth is the change in inhabitants over time; it can be positive or negative and expressed in numbers or percentages.
- Natural growth equals births minus deaths; actual growth also includes in-migration and out-migration.
- CBR and CDR are calculated per 1,000 people using estimated mid-year population.
- Births, deaths, and migration are the three components of population change.
- Migration changes population at both origin and destination and may be permanent, temporary, or seasonal.
- A migrant is an immigrant at the destination and an emigrant at the place of origin.
- Push factors encourage people to leave; pull factors attract them to a destination.
Demographic Transition And Population Control Measures
Demographic Transition
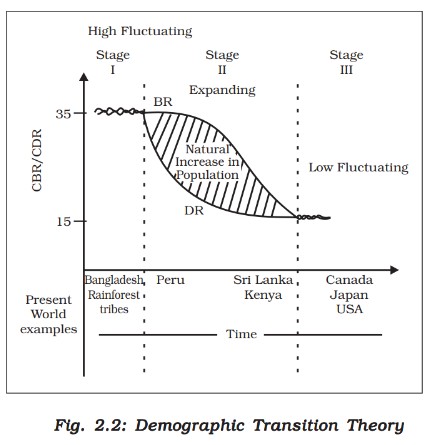
Demographic transition theory — A model that describes and predicts how a region’s population shifts from high birth and death rates to low birth and death rates as society develops.
- Social change: The transition accompanies a shift from a rural, agrarian and largely illiterate society to an urban, industrial and literate society.
- Demographic cycle: The stages of change in birth and death rates collectively form the demographic cycle.
- Different stages: Countries today can be at different stages of demographic transition.
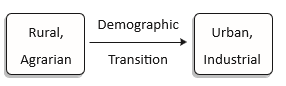
| Stage | Fertility / birth rate | Mortality / death rate | Population pattern and society |
|---|---|---|---|
| 1 | High | High | Slow growth. High reproduction compensates for deaths from epidemics and variable food supply. Agriculture is dominant, and large families are useful. Life expectancy, literacy and technology are low; about 200 years ago, all countries were at this stage. |
| 2 | High initially, then declines | Declines as sanitation and health improve | The gap between high fertility and falling mortality causes a large net addition to the population. |
| 3 | Low | Low | Population is stable or grows slowly. Society is urbanised and literate, has high technical know-how, and deliberately controls family size. |
Population Control Measures
Family planning — Spacing or preventing the birth of children.
- Benefits: Access to family-planning services helps limit population growth and improve women’s health.
- Measures: Population growth can be controlled through propaganda, free availability of contraceptives, and tax disincentives for large families.
Malthusian theory — In 1798, Thomas Malthus argued that population would grow faster than the food supply, risking a population crash.
Population growth and Malthus’s checks
- Population increases faster than food supply.
- Food becomes insufficient to support the population.
- A population crash may follow through famine, disease and war.
- Malthus considered preventive checks preferable to physical checks.
- Rapid population growth must be controlled to ensure the sustainability of resources.
- The demographic transition shows that people can adjust their fertility as society changes.
Quick recap
- Demographic transition describes a shift from high birth and death rates to low rates as society develops.
- Stage 1 has high fertility and mortality, with slow growth and low life expectancy, literacy and technology.
- In Stage 2, mortality falls while fertility remains high, causing a large population increase.
- Stage 3 has low fertility and mortality, so population is stable or grows slowly.
- Family planning and contraceptive access can limit population growth and improve women’s health.
- Malthus (1798) warned that population could outpace food supply, leading to famine, disease and war.
- Controlling rapid population growth supports resource sustainability.
Geography — ALL CHAPTERS
1
Human Geography Nature And Scope
2
The World Population Distribution, Density And Growth
3
Human Development
4
Primary Activities
5
Secondary Activities
6
Tertiary And Quaternary Activities
7
Transport And Communication
8
International Trade
1
UNIT -I POPULATION DISTRIBUTION ,DENSITY, GROWTH AND COMPOSITION
2
UNIT -II HUMAN SETTLEMENTS
3
UNIT- III LAND RESOURCES AND AGRICULTURE
4
UNIT -III WATER RESOURCES
5
UNIT - III MINERAL AND ENERGY RESOURCES
6
UNIT -III PLANNING AND SUSTAINABLE DEVELOPMENT IN INDIAN CONTEXT
7
UNIT -IV TRANSPORT AND COMMUNICATION
8
UNIT -IV INTERNATIONAL TRADE
9
UNIT - V GEOGRAPHICAL PERSPECTIVE ON SELECTED ISSUES AND PROBLEMS