Class 12 Humanities . Geography . India People And Economy . Unit I Population Distribution Density Growth and Composition
Chapter 1: UNIT -I POPULATION DISTRIBUTION ,DENSITY, GROWTH AND COMPOSITION
Ch 1
Geography
Class 12 Humanities
Distribution of Population
India’s Population
- Population size: In 2011, India was the world’s second most populous country after China, with 1,210 million people.
- Scale: India’s population was larger than the combined population of North America, South America and Australia.
- Resource pressure: A large population may put pressure on limited resources and contribute to socio-economic problems.
Sources of Population Data
- Census: Population data in India are collected through a census conducted every 10 years.
Population Census in India
- 1872India’s first population census was conducted.
- 1881India’s first complete census was conducted.
Spatial Distribution of Population
Population distribution — The spatial pattern showing where people live and how they are spread across a region.
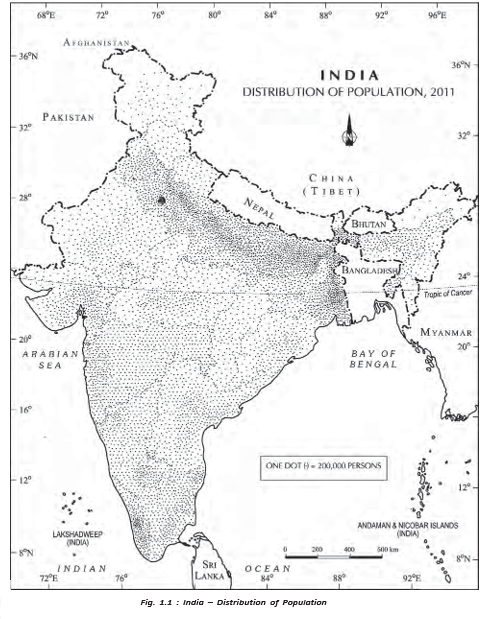
- Uneven pattern: India’s population is distributed very unevenly across states and regions.
- Most populous states: Uttar Pradesh has the largest population, followed by Maharashtra, Bihar and West Bengal.
- High population share: Uttar Pradesh, Maharashtra, Bihar, West Bengal, Andhra Pradesh, Tamil Nadu, Madhya Pradesh, Rajasthan, Karnataka and Gujarat together account for about 76% of India’s population.
- Small population shares: Jammu and Kashmir (1.04%), Uttarakhand (0.84%) and Arunachal Pradesh (0.11%) have small shares despite their fairly large geographical areas.
Factors Affecting Population Distribution
- Main relationship: Uneven population distribution reflects the combined influence of physical, socio-economic and historical factors.
| Factor | Influence and examples |
|---|---|
| Physical | Climate, terrain and water availability strongly affect population distribution. |
| Favourable physical settings | The North Indian Plains, river deltas and coastal plains have higher population concentrations. |
| Less favourable settings | Interior districts of southern and central India, the Himalayas, parts of the north-east and western states are generally less populated. |
| Resource and infrastructure development | Irrigation in Rajasthan, mineral and energy resources in Jharkhand, and transport development in Peninsular India have increased concentration in some formerly thinly populated areas. |
| Socio-economic and historical | Settled agriculture, agricultural development, settlement patterns, transport networks, industrialisation and urbanisation shape population distribution. |
Why Plains and Coastal Regions Remain Population Centres
- Favourable land and water conditions support agriculture and settlement.
- Early human settlement and agricultural development establish lasting population centres.
- Transport networks strengthen connections.
- Population concentration remains high even where land and water resources show signs of degradation.
Urban Population Concentration
- Industrial development and urbanisation draw rural–urban migrants.
- This contributes to high population concentration in Delhi, Mumbai, Kolkata, Bengaluru, Pune, Ahmedabad, Chennai and Jaipur.
Why is population distribution uneven in India?
Give examples of developments that have increased population concentration in some areas.
Quick recap
- India had 1,210 million people in 2011 and ranked second in population after China.
- The census is conducted every 10 years; the first was in 1872 and the first complete census in 1881.
- Population distribution in India is highly uneven, with Uttar Pradesh the most populous state.
- Ten major states together account for about 76% of the country’s population.
- Climate, terrain and water availability influence population concentration.
- Agriculture, settlement history, transport, industry, urbanisation and migration also shape distribution.
Density of Population
Meaning and Change in Population Density
Population density — The number of people living per unit area; it helps describe how population is distributed in relation to land.
Population Density in India
- Use: Density is a crude measure of the relationship between people and land.
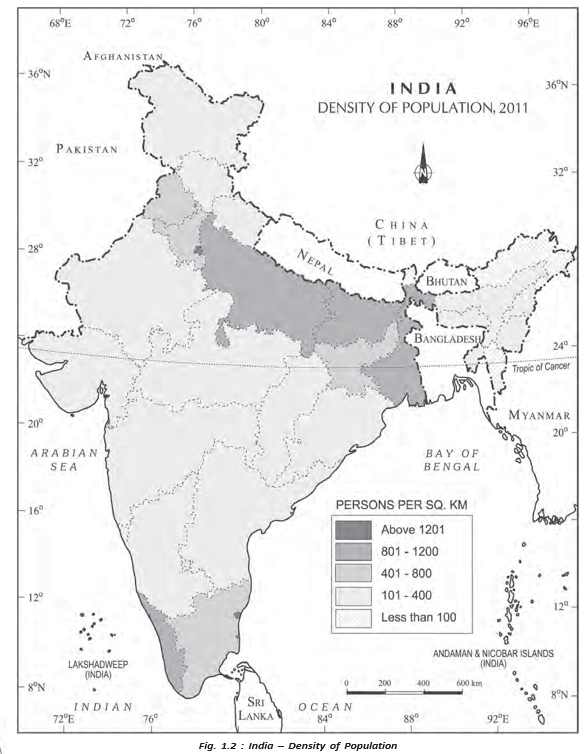
- India in 2011: Population density was 382 persons per sq km.
- Long-term change: Density rose by more than 200 persons per sq km from 1951 to 2011.
India’s Population Density
- 1951India’s population density was 117 persons per sq km.
- 2011India’s population density reached 382 persons per sq km.
Spatial Variation Across India
| Area or pattern | Density | Examples |
|---|---|---|
| Lowest state density | 17 persons per sq km | Arunachal Pradesh |
| Highest density | 11,297 persons per sq km | National Capital Territory of Delhi |
| Higher-density northern states | Bihar: 1,102; West Bengal: 1,029; Uttar Pradesh: 828 persons per sq km | Bihar, West Bengal and Uttar Pradesh |
| Higher-density peninsular states | Kerala: 859; Tamil Nadu: 555 persons per sq km | Kerala and Tamil Nadu |
| Moderate density | Moderate | Assam, Gujarat, Andhra Pradesh, Haryana, Jharkhand and Odisha |
| Relatively low density | Relatively low | Himalayan hill states and North-Eastern states, except Assam |
| Very high density | Very high | Union Territories, except Andaman and Nicobar Islands |
Measures of Pressure on Cultivable Land
Why Use More Specific Measures?
- Limitation: Overall population density gives only a crude measure of the human–land relationship.
- Better insight: Physiological and agricultural densities show population pressure in relation to cultivated land.
- Relevance to India: These measures are important because a large share of the population depends on agriculture.
Relates total population to net cultivated area. Here, is total population and is net cultivated area.
Relates agricultural population to net cultivable area. Here, is total agricultural population and is net cultivable area.
Agricultural population — Cultivators, agricultural labourers and their family members.
What is the difference between physiological density and agricultural density?
Quick recap
- Population density is the number of people per unit area.
- India’s density rose from 117 persons per sq km in 1951 to 382 in 2011.
- Density varies widely across India, from 17 in Arunachal Pradesh to 11,297 in Delhi.
- Himalayan hill states and most North-Eastern states have relatively low density.
- Physiological density compares total population with net cultivated area.
- Agricultural density compares agricultural population with net cultivable area.
Growth of Population
Meaning and Components of Population Growth
Population growth — The change in the number of people living in an area between two points in time; its rate is expressed as a percentage.
Components and Key Figures
- Natural growth is analysed using crude birth and death rates.
- Induced growth results from inward and outward migration.
- Scope of this lecture: Natural growth of India’s population.
- Annual growth rate: India’s population growth rate was 1.64% in 2011.
Use the base-year population and the later-year population to calculate the percentage change.
India’s Population Growth, 1901–2011
- Symbols: is the population in the base year; is the population in the later year.
- Trend: Decadal and annual growth rates were high, though the decadal rate varied over time.
| Census year | Total population | Absolute growth | Decadal growth rate |
|---|---|---|---|
| 1901 | 238,396,327 | — | — |
| 1911 | 252,093,390 | +13,693,066 | +5.85% |
| 1921 | 251,321,213 | −520,120 | −0.31% |
| 1931 | 278,977,238 | +27,656,020 | +12.60% |
| 1941 | 318,660,580 | +39,683,342 | +14.10% |
| 1951 | 361,088,090 | +42,420,445 | +11.60% |
| 1961 | 439,234,771 | +77,684,826 | +13.82% |
| 1971 | 548,159,652 | +108,924,882 | +20.80% |
| 1981 | 683,329,097 | +135,169,430 | +23.66% |
| 1991 | 846,302,688 | +162,973,590 | +24.86% |
| 2001 | 1,028,610,328 | +182,307,040 | +20.54% |
| 2011 | 1,210,193,422 | +181,383,094 | +17.64% |
Population doubling time — The time required for a population to double at its current annual growth rate.
Four Phases of Population Growth in India
Phases of Population Growth
- 1901–1921Stagnant or stationary phase; growth was very low and turned negative during 1911–1921.
- 1921–1951Steady growth as mortality declined while birth rates remained high.
- 1951–1981Population explosion caused by a rapid fall in mortality and continued high fertility.
- Post-1981 to the period describedGrowth remained high but gradually slowed.
Causes of Change Across the Phases
- Phase I (1901–1921): Poor health and medical services, widespread illiteracy and inefficient food distribution → high birth and death rates → very low growth, including a negative rate in 1911–1921.
- Phase II (1921–1951): Improved health, sanitation, transport and communication → lower mortality and better distribution; birth rates stayed high → faster growth than in Phase I.
- Phase III (1951–1981): Rapidly falling mortality + high fertility → high natural increase and population explosion; average annual growth reached 2.2%.
- Phase III contributors: Post-independence development and improved living conditions, plus increased migration from Tibet, Bangladesh, Nepal and Pakistan → further growth.
- Phase IV (post-1981): Higher mean age at marriage and improved quality of life, especially female education → lower crude birth rate → gradual slowing of growth.
Population Outlook
- Continuing pattern: India’s population growth remained high, although it was gradually slowing.
- Projection cited: The World Development Report projected a population of 1,350 million by 2025.
Regional Variation in Population Growth
| Growth pattern | States and Union Territories |
|---|---|
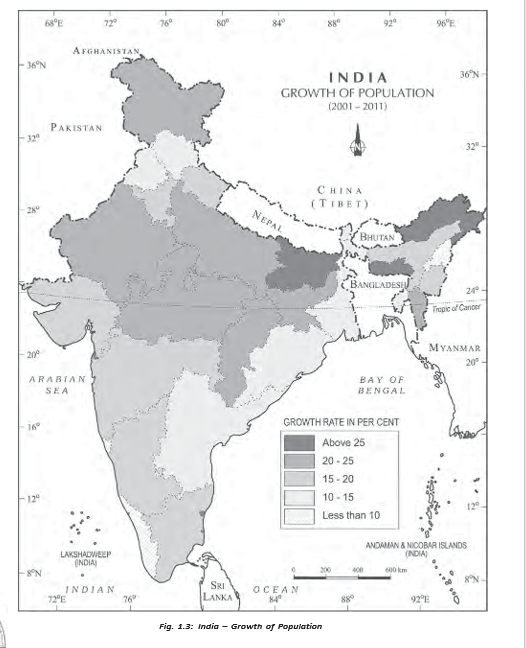
| Low growth: did not exceed 20% | Kerala, Karnataka, Tamil Nadu, Andhra Pradesh, Odisha, Puducherry and Goa. Kerala recorded the country’s lowest rate: 9.4%. |
| Relatively high growth: about 20–25% on average | A west-to-east belt across north-western, northern and north-central India: Gujarat, Maharashtra, Rajasthan, Punjab, Haryana, Uttar Pradesh, Uttarakhand, Madhya Pradesh, Sikkim, Assam, West Bengal, Bihar, Chhattisgarh and Jharkhand. |
Changes Between the 1991–2001 and 2001–2011 Decades
- Overall: Almost all States and Union Territories had lower growth rates in 2001–2011 than in 1991–2001.
- Six most populous States: Uttar Pradesh, Maharashtra, Bihar, West Bengal, Andhra Pradesh and Madhya Pradesh all recorded declines.
- Declines among these six: Maharashtra had the largest fall, 6.7 percentage points; Andhra Pradesh had the smallest, 3.5 percentage points.
- Increases: Tamil Nadu rose by 3.9 percentage points and Puducherry by 7.1 percentage points.
Adolescents and Youth
Adolescent population — People aged 10–19 years; adolescents made up about 20.9% of India’s population in 2011.
Adolescent Population: Composition and Challenges
- Composition (2011): Male adolescents were 52.7% and female adolescents 47.3% of the adolescent population.
- Potential and vulnerability: Adolescents have great potential but need guidance and support to channel it effectively.
- Social and educational challenges: Early marriage, illiteracy (especially among females), school dropouts and inadequate nutrient intake.
- Health challenges: High maternal mortality among adolescent mothers, HIV and AIDS infections, and physical or mental disabilities.
- Other concerns: Drug abuse, alcoholism, juvenile delinquency and crime.
| Policy | Date and purpose |
|---|---|
| National Youth Policy (NYP–2014) | Launched in February 2014. Aims to empower youth to reach their full potential and help India attain its rightful place among nations; defines youth as people aged 15–29. |
| National Policy for Skill Development and Entrepreneurship | Formulated in 2015 to provide an umbrella framework for skill-development activities, align them to common standards and connect skills with demand centres. |
Describe the four phases of population growth in India.
What caused the population explosion in India during 1951–1981?
What were the adolescent and youth age groups and key population figures given?
Quick recap
- Population growth is the change in population over time; it has natural and migration-related components.
- Decadal growth rate compares the population change with the base-year population.
- India’s four phases were stagnant (1901–1921), steady (1921–1951), explosive (1951–1981) and gradually slowing (post-1981).
- For 1991–2001, several states had growth rates up to and including 20%, while a broad northern and central belt averaged about 20–25%.
- Adolescents aged 10–19 formed 20.9% of India’s population in 2011; NYP–2014 defines youth as ages 15–29.
- National youth and skill-development policies aim to support young people through empowerment, education and skills.
Population Composition
Population composition — The study of a population’s characteristics, including age, sex, residence, ethnicity, language, religion, marital status, education and occupation.
Focus of this lecture
- Main dimensions covered: Rural–urban residence, language and religion.
- Why it matters: These characteristics reflect the social and cultural patterns of a population.
Rural–Urban Composition
Rural–urban composition — The distribution of people between rural and urban places of residence.
Rural population
- Share: About 68.8% of India’s population lived in villages in 2011.
- Villages (2011): India had 640,867 villages; 597,608 (93.2%) were inhabited.
- Variation: Himachal Pradesh and Bihar had high rural proportions; Goa and Mizoram had only slightly more than half their populations in villages.
- Union Territories: Most had relatively small rural populations; Dadra and Nagar Haveli was an exception, with 53.38%.
- Village size: Under 200 people in some hill areas of the north-east, western Rajasthan and the Rann of Kachchh; as high as 17,000 in Kerala and parts of Maharashtra.
- Distribution factors: Urbanisation levels and rural–urban migration shape rural-population concentration within and between states.
Urban population and its growth
- Share: The urban population was 31.16% in the figures given for this lecture; its proportion was much lower than the rural share.
- Growth: Urban population has grown faster over the decades, supported by economic development and improved health and hygiene.
- Urban increase: Growth in almost all states and Union Territories indicates urban socio-economic development as well as increased rural–urban migration.
- Migration corridors: Strong around main roads and railways in the North Indian Plains, and in areas around Kolkata, Mumbai, Bengaluru–Mysuru, Madurai–Coimbatore, Ahmedabad–Surat, Delhi–Kanpur and Ludhiana–Jalandhar.
- Low urbanisation: Found in stagnant agricultural areas of the middle and lower Ganga Plains, Telangana, non-irrigated western Rajasthan, remote north-eastern hill and tribal areas, flood-prone parts of Peninsular India and eastern Madhya Pradesh.
| Point | Rural | Urban |
|---|---|---|
| 2011 share | About 68.8% | 31.16% in the figures given |
| Pattern | Concentration varies with urbanisation and migration | Distribution varies widely; urban population is increasing across nearly all states and UTs |
| Key influence | Rural–urban migration and degree of urbanisation | Economic development, improved health and hygiene, and rural–urban migration |
Linguistic Composition
Language diversity
- Linguistic diversity: India has many languages and dialects.
- Grierson’s survey (1903–1928): Recorded 179 languages and 544 dialects.
- Modern classification: India has about 22 scheduled languages, alongside many non-scheduled languages.
- Largest scheduled-language group: Hindi speakers.
- Smallest groups (2011): Sanskrit, Bodo and Manipuri speakers.
- Language regions: Linguistic boundaries are generally gradual; regions merge and overlap in frontier zones rather than ending at sharp borders.
| Family and share | Sub-families / branches | Main speech areas |
|---|---|---|
| Austric (Nishada), 1.38% | Austro-Asiatic: Mon-Khmer; Munda. Austro-Nesian: listed outside India. | Mon-Khmer: Meghalaya and Nicobar Islands. Munda: West Bengal, Bihar, Odisha, Assam, Madhya Pradesh and Maharashtra. |
| Dravidian (Dravida), 20% | South-, Central- and North-Dravidian | South: Tamil Nadu, Karnataka and Kerala. Central: Andhra Pradesh, Madhya Pradesh, Odisha and Maharashtra. North: Bihar, Odisha, West Bengal and Madhya Pradesh. |
| Sino-Tibetan (Kirata), 0.85% | Tibeto-Myanmari: Tibeto-Himalayan and North Assam; Siamese-Chinese: Assam-Myanmari | Tibeto-Himalayan: Jammu and Kashmir, Himachal Pradesh and Sikkim. North Assam: Arunachal Pradesh. Assam-Myanmari: Assam, Nagaland, Manipur, Mizoram, Tripura and Meghalaya. |
| Indo-European (Aryan), 77% | Indo-Aryan: Iranian, Dardic and Indo-Aryan | Iranian: outside India. Dardic: Jammu and Kashmir. Indo-Aryan: Jammu and Kashmir, Punjab, Himachal Pradesh, Uttar Pradesh, Rajasthan, Haryana, Madhya Pradesh, Bihar, Odisha, West Bengal, Assam, Gujarat, Maharashtra and Goa. |
Religious Composition
Religion and its spatial distribution
- Importance: Religion influences cultural and political life and is closely connected with family and community life.
- Regional pattern: A religious community may have a large population in some states or districts but be sparsely represented elsewhere.
- Hindus: The largest group; they form about 70–90% or more in many states. Their share is lower in some border districts, Jammu and Kashmir, north-eastern hill states and scattered parts of the Deccan Plateau and Ganga Plain.
- Muslims: India’s largest religious minority; concentrated in Jammu and Kashmir, selected districts of West Bengal and Kerala, many districts of Uttar Pradesh, Delhi and Lakshadweep. They form a majority in the Kashmir Valley and Lakshadweep.
| Religious group | Population (million) | Share of total |
|---|---|---|
| Hindus | 966.3 | 79.8% |
| Muslims | 172.2 | 14.2% |
| Christians | 27.8 | 2.3% |
| Sikhs | 20.8 | 1.7% |
| Buddhists | 8.4 | 0.7% |
| Jains | 4.5 | 0.4% |
| Other Religions and Persuasions (ORP) | 7.9 | 0.7% |
| Religion not stated | 2.9 | 0.2% |
Religion and Landscape
Religious communities and cultural landscapes
- Landscape expressions: Sacred buildings, cemeteries, religious plant and animal associations, and sacred groves make religion visible in the landscape.
- Sacred structures: These range from village shrines to large temples, mosques and cathedrals; temples, mosques, gurdwaras, monasteries and churches vary in size, form, space use and density.
- Christians: Mainly rural in distribution; concentrations occur on the western coast around Goa and Kerala, and in Meghalaya, Mizoram, Nagaland, the Chotanagpur area and the hills of Manipur.
- Sikhs: Concentrated mainly in Punjab, Haryana and Delhi.
- Jains: Concentrated especially in urban areas of Rajasthan, Gujarat and Maharashtra.
- Buddhists: Concentrated mainly in Maharashtra; other areas with Buddhist majorities include Sikkim, Arunachal Pradesh, Ladakh, Tripura, and Lahaul and Spiti.
- Other faiths: Zoroastrian, tribal and other indigenous beliefs occur in small, scattered pockets.
- Scheduled languages
- Languages officially included in the Eighth Schedule of the Constitution of India.
- Dialect
- A regional or social variety of a language.
- Rural–urban migration
- Movement of people from rural areas to urban areas.
- Religious landscape
- Visible features of an area shaped by religious beliefs and practices.
What factors help explain the growth and distribution of India’s urban population?
Name the four major language families of India and give their approximate shares.
Describe the main regional concentrations of Christians, Sikhs, Jains and Buddhists in India.
Quick recap
- Population composition studies social, cultural, demographic and economic characteristics of a population.
- In 2011, about 68.8% of India’s population was rural; village size and rural concentration varied greatly.
- Urbanisation grew with economic development, better health and hygiene, and rural–urban migration.
- India’s languages belong mainly to four families: Indo-European, Dravidian, Austric and Sino-Tibetan.
- Hindus formed 79.8% and Muslims 14.2% of India’s population in 2011.
- Religious communities show distinct regional concentrations and contribute visible features to cultural landscapes.
Composition of Working Population
Economic Status of the Population
India’s Worker–Non-worker Balance
- 2011: Workers (main and marginal combined) made up 39.8% of India’s population; about 60% were non-workers.
- Implication: The large non-worker share suggests a high dependent population and may also indicate unemployment or underemployment.
Work Participation Rate
Use this to calculate the share of workers in a population.
Regional Variation in Work Participation
- Range: Work participation varied from 29.1% in Lakshadweep to 51.9% in Himachal Pradesh.
- Higher-participation states: Himachal Pradesh, Sikkim, Chhattisgarh, Andhra Pradesh, Karnataka, Arunachal Pradesh, Nagaland, Manipur and Meghalaya.
- Higher-participation Union Territories: Dadra and Nagar Haveli, and Daman and Diu.
- Reason: Rates can be higher in less economically developed areas because subsistence activities often require more manual workers.
Occupational Composition
Sector Shares in 2011
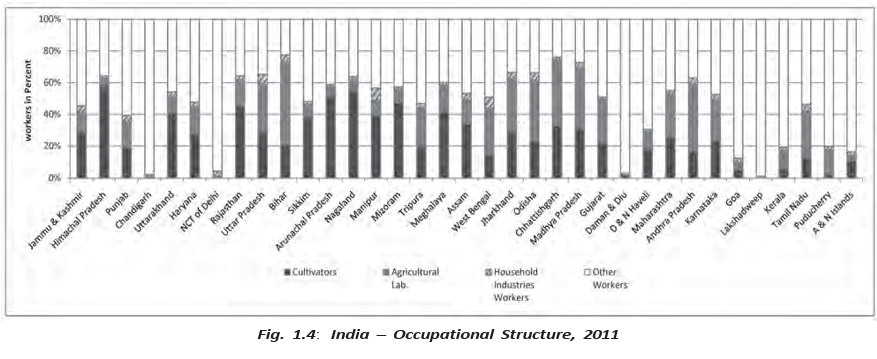
- Primary: 54.6% of workers were cultivators and agricultural labourers.
- Secondary: 3.8% worked in household industries.
- Tertiary: 41.6% were other workers, including those in non-household industries, trade, commerce, construction, repair and services.
- Overall pattern: Primary-sector workers formed the largest share of the workforce.
Gender and Work
- Gender inequality: Social roles can lead to discrimination and exclusion, limiting women’s access to education, employment, political representation, equal wages and a dignified life.
- Beti Bachao–Beti Padhao: The Government of India launched this nationwide campaign to address gender discrimination and promote the well-being and empowerment of girls.
2011 Census Occupational Categories
| Sector | Persons | % of total workers | Male | Female |
|---|---|---|---|---|
| Primary | 26,30,22,473 | 54.6% | 16,54,47,075 | 9,75,75,398 |
| Secondary | 1,83,36,307 | 3.8% | 97,75,635 | 85,60,672 |
| Tertiary | 20,03,84,531 | 41.6% | 15,66,43,220 | 4,37,41,311 |
Gender Pattern in Sectoral Employment
- Male workers outnumbered female workers in each of the three sectors.
- Female workers were relatively more numerous in the primary sector; women’s participation in secondary and tertiary work has improved in recent years.
Change in Sectoral Employment
- 2001Agricultural workers made up 58.2% of the workforce.
- 2011The agricultural share fell to 54.6%, while the secondary and tertiary shares increased.
Sectoral Shift
- Declining share of agricultural work
- Increasing participation in secondary and tertiary sectors
- Shift from farm-based to non-farm occupations
Regional Variation by Occupation
- Cultivators: Himachal Pradesh and Nagaland have large shares of cultivators.
- Agricultural labourers: Bihar, Andhra Pradesh, Chhattisgarh, Odisha, Jharkhand, West Bengal and Madhya Pradesh have higher proportions.
- Other services: Highly urbanised Delhi, Chandigarh and Puducherry have large shares of workers in these activities.
- Why regions differ: Limited farmland, urbanisation and industrialisation increase the need for non-farm workers.
What are the four occupational categories used by the 2011 Census?
What does the changing agricultural workforce share indicate?
Quick recap
- In 2011, 39.8% of India’s population were workers and about 60% were non-workers.
- Main workers work at least 183 days a year; marginal workers work fewer than 183 days.
- Work participation ranged from 29.1% in Lakshadweep to 51.9% in Himachal Pradesh.
- The four Census categories are cultivators, agricultural labourers, household industrial workers and other workers.
- In 2011, primary, secondary and tertiary sectors accounted for 54.6%, 3.8% and 41.6% of workers, respectively.
- Agricultural employment fell from 58.2% in 2001 to 54.6% in 2011, indicating a shift towards non-farm work.
- Male workers outnumbered female workers in all sectors; women were relatively more represented in the primary sector.
Geography — ALL CHAPTERS
1
Human Geography Nature And Scope
2
The World Population Distribution, Density And Growth
3
Human Development
4
Primary Activities
5
Secondary Activities
6
Tertiary And Quaternary Activities
7
Transport And Communication
8
International Trade
1
UNIT -I POPULATION DISTRIBUTION ,DENSITY, GROWTH AND COMPOSITION
2
UNIT -II HUMAN SETTLEMENTS
3
UNIT- III LAND RESOURCES AND AGRICULTURE
4
UNIT -III WATER RESOURCES
5
UNIT - III MINERAL AND ENERGY RESOURCES
6
UNIT -III PLANNING AND SUSTAINABLE DEVELOPMENT IN INDIAN CONTEXT
7
UNIT -IV TRANSPORT AND COMMUNICATION
8
UNIT -IV INTERNATIONAL TRADE
9
UNIT - V GEOGRAPHICAL PERSPECTIVE ON SELECTED ISSUES AND PROBLEMS